TET1 controls CNS 5-methylcytosine hydroxylation, active DNA demethylation, gene transcription, and memory formation - PubMed (original) (raw)
TET1 controls CNS 5-methylcytosine hydroxylation, active DNA demethylation, gene transcription, and memory formation
Garrett A Kaas et al. Neuron. 2013.
Abstract
Dynamic changes in 5-methylcytosine (5mC) have been implicated in the regulation of gene expression critical for consolidation of memory. However, little is known about how these changes in 5mC are regulated in the adult brain. The enzyme methylcytosine dioxygenase TET1 (TET1) has been shown to promote active DNA demethylation in the nervous system. Therefore, we took a viral-mediated approach to overexpress the protein in the hippocampus and examine its potential involvement in memory formation. We found that Tet1 is a neuronal activity-regulated gene and that its overexpression leads to global changes in modified cytosine levels. Furthermore, expression of TET1 or a catalytically inactive mutant (TET1m) resulted in the upregulation of several neuronal memory-associated genes and impaired contextual fear memory. In summary, we show that neuronal Tet1 regulates DNA methylation levels and that its expression, independent of its catalytic activity, regulates the expression of CNS activity-dependent genes and memory formation.
Copyright © 2013 Elsevier Inc. All rights reserved.
Figures
Figure 1. TET1 is expressed in neurons and its transcript levels are altered by neuronal activity
(A, B) NeuN labeled neurons and TET1 labeled cells in the hippocampus. (C) Merged image of NeuN and TET1 double labeling, counterstained with DAPI. Inset, higher magnification of the CA1 pyramidal cell layer showing merged signal present in the soma of neurons. (D, E) GFAP labeled astrocytes and TET1 labeled cells in the hippocampus. (E) Merged image of GFAP and TET1 double labeling, counterstained with DAPI. Inset, higher magnification of a GFAP positive cell with TET1 labeling in the soma. Scale bar, 200μm. Inset scale bar 20μm.(G) Quantitative reverse-transcription PCR (qRT-PCR) analysis of Tet1 expression in primary hippocampal neuron cultures depolarized with 25 mM KCl for 0.5, 1 and 4 h compared to vehicle controls. Data represent the combined results of two independent experiments (F3, 22 = 23.91; n = 5–6 total/group). Vehicle vs. 4 h KCl treatment. ***p < 0.001, one-way ANOVA followed by Bonferroni post hoc test. (H) qRT-PCR analysis of Tet1 expression in dorsal CA1 subregion 0.5, 1 and 3 h after flurothyl-induced seizures, compared to controls. Data represent the combined results of three independent experiments (F3, 25 = 4.443; n = 6–7 total/group). Naive vs. 3 h. *p < 0.05, one-way ANOVA followed by Bonferroni post hoc test. (I) qRT-PCR analysis of Tet1 expression in dorsal CA1 0.5, 1 and 3 h after fear conditioning compared to naïve controls. Data represent the combined results of three independent experiments (F3, 35 = 5.352; n = 9 total/group). Naive vs. 1 and 3 h. *p < 0.05, one-way ANOVA followed by Bonferroni post hoc test. All data are presented as mean ± s.e.m. See also Figures S1 and S2.
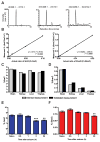
Figure 2. Measurement of global 5mC and 5hmC levels in the hippocampus following neuronal activation
(A) LC-MS/MS-MRM chromatograms of nucleosides using three commercial 948-bp standard DNA fragments (dmC .01, dhmC .001, and dC 1.0) showing peaks corresponding to the response obtained from gas phase transitions of dC to C, dmC to mC, and dhmC to hmC. cps, counts per second. (B) Standard curves for 5mC and 5hmC. The percentages of 5mC and 5hmC are plotted against the known ratios of methylated and hydroxymethylated DNA to the total amount of cytosine in the standard samples. (C, D) Validation of HPLC/MS system for 5mC and 5hmC detection accuracy was performed using a set of previously characterized genomic DNA samples (Zymo Research). (E, F) Percentages of 5mC and 5hmC in genomic DNA from several different tissue sources (n = 3/group). (G, H) 5mC and 5hmC levels in area CA1 of adult mice at several time points following flurothyl induced seizures compared to controls (_F_4, 29 = 13.41; each sample represents the average of 3 technical replicates, n = 6/group). Naive vs. 3 or 24 h. **p < 0.01, ***p < 0.001; one-way ANOVA followed by Bonferroni post hoc test. In figures E- H data are presented as mean ± s.e.m.
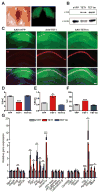
Figure 3. Functional characterization of AAV-mediated expression of TET1 and TET1m in the dorsal hippocampus
(A) Representative images of YFP expression 14 d after AAV injection along the anterior-posterior axis of the hippocampus under white and UV light, respectively. (B) Protein samples from area CA1 tissue expressing YFP, HA-TET1 or HA-TET1m analyzed by western blot to confirm expression of both peptides. Actin was used as a loading control. (C) Representative images of dorsal hippocampal sections 14 d after AAV-mediated expression of YFP, TET1 and TET1m. Sections were double labeled with anti-GFP, anti-HA and conterstained with DAPI. Robust viral expression was restricted to area CA1. Scale bar, 200 μm. (D) Percent 5mC in microdissected area CA1 (_F_2, 12 = 66.68; n = 4–5/group). YFP vs. TET1. ***p < 0.001, one-way ANOVA followed by Bonferroni post hoc test. (E) Percent 5hmC in microdissected area CA1 14 d after AAV injection (F2, 11 = 37.34; n = 4/group). YFP vs. TET1. ***p < 0.001, one-way ANOVA followed by Bonferroni post hoc test. (F) Percent unmodified cytosines in microdissected area CA1 (F2, 12 = 31.04). YFP vs. TET1. ***p < 0.001, one-way ANOVA followed by Bonferroni post hoc test (n = 4–5/group). Data are presented as mean ± s.e.m. (G) qRT-PCR analysis of genes involved in synaptic plasticity and memory formation 14 d after viral injection (_Gusb, F_2,11 = 4.97; Arc, F2,11 = 11.42; Egr1, F2,11 = 5.57, Fos, F2,11 = 4.66; Bdnf, F2,11 = 11.96; Nr4a2, F2,11 = 14.92; Homer1a, F2,11 = 27.23; Tdg, F2,24 = 10.17; Apobec1, F2,24 = 5.37; Smug1, F2,24 = 13.92; Mbd4, F2,24 = 5.52). (n =4/group from one representative experiment). For Tdg, Apobec1, Smug1 and Mbd4 (n = 8–9 combined from two independent experiments).*p < 0.05, **p < 0.01, ***p < 0.001; one-way ANOVA. All data are presented as mean ± s.e.m.
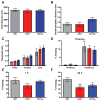
Figure 4. Behavioral characterization of mice overexpressing TET1 and TET1m in the dorsal hippocampus
(A) Total distance traveled during 15 min in the open field. (B) The ratio of time spent in the center versus time spent in the periphery of the open field, a measure of anxiety. (C) Shock threshold test. (D) Percent of time freezing before and after presentation of the foot shock during the 3 min training session. (E) Percent of time freezing during a 5 min context test, 1 h after training. For experiments A–C, E n = 9 for all groups. (F) Percent of time freezing during a 5 min context test, 24 h after training (F2, 58 = 7.185). YFP vs. TET1 and TET1m. **p < 0.01, *p < 0.05; one-way ANOVA followed by Bonferroni post hoc test. For experiments D and F; AAV-YFP (n = 17), AAV-TET1 (n = 21), AAV-TET1m (n = 21). All data are presented as mean ± s.e.m.
Similar articles
- Tet1 Isoforms Differentially Regulate Gene Expression, Synaptic Transmission, and Memory in the Mammalian Brain.
Greer CB, Wright J, Weiss JD, Lazarenko RM, Moran SP, Zhu J, Chronister KS, Jin AY, Kennedy AJ, Sweatt JD, Kaas GA. Greer CB, et al. J Neurosci. 2021 Jan 27;41(4):578-593. doi: 10.1523/JNEUROSCI.1821-20.2020. Epub 2020 Dec 1. J Neurosci. 2021. PMID: 33262245 Free PMC article. - Tet1 is critical for neuronal activity-regulated gene expression and memory extinction.
Rudenko A, Dawlaty MM, Seo J, Cheng AW, Meng J, Le T, Faull KF, Jaenisch R, Tsai LH. Rudenko A, et al. Neuron. 2013 Sep 18;79(6):1109-1122. doi: 10.1016/j.neuron.2013.08.003. Neuron. 2013. PMID: 24050401 Free PMC article. - Suppression of DNA Double-Strand Break Formation by DNA Polymerase β in Active DNA Demethylation Is Required for Development of Hippocampal Pyramidal Neurons.
Uyeda A, Onishi K, Hirayama T, Hattori S, Miyakawa T, Yagi T, Yamamoto N, Sugo N. Uyeda A, et al. J Neurosci. 2020 Nov 18;40(47):9012-9027. doi: 10.1523/JNEUROSCI.0319-20.2020. Epub 2020 Oct 21. J Neurosci. 2020. PMID: 33087478 Free PMC article. - The role of active DNA demethylation and Tet enzyme function in memory formation and cocaine action.
Alaghband Y, Bredy TW, Wood MA. Alaghband Y, et al. Neurosci Lett. 2016 Jun 20;625:40-6. doi: 10.1016/j.neulet.2016.01.023. Epub 2016 Jan 19. Neurosci Lett. 2016. PMID: 26806038 Free PMC article. Review. - Role of ten-eleven translocation proteins and 5-hydroxymethylcytosine in hepatocellular carcinoma.
Wang P, Yan Y, Yu W, Zhang H. Wang P, et al. Cell Prolif. 2019 Jul;52(4):e12626. doi: 10.1111/cpr.12626. Epub 2019 Apr 29. Cell Prolif. 2019. PMID: 31033072 Free PMC article. Review.
Cited by
- DNA Methylation-Dependent Dysregulation of GABAergic Interneuron Functionality in Neuropsychiatric Diseases.
Linde J, Zimmer-Bensch G. Linde J, et al. Front Neurosci. 2020 Sep 16;14:586133. doi: 10.3389/fnins.2020.586133. eCollection 2020. Front Neurosci. 2020. PMID: 33041771 Free PMC article. Review. - Tet1-mediated 5hmC regulates hippocampal neuroinflammation via wnt signaling as a novel mechanism in obstructive sleep apnoea leads to cognitive deficit.
Kong Y, Ji J, Zhan X, Yan W, Liu F, Ye P, Wang S, Tai J. Kong Y, et al. J Neuroinflammation. 2024 Aug 21;21(1):208. doi: 10.1186/s12974-024-03189-2. J Neuroinflammation. 2024. PMID: 39169375 Free PMC article. - Tcf4 Regulates Synaptic Plasticity, DNA Methylation, and Memory Function.
Kennedy AJ, Rahn EJ, Paulukaitis BS, Savell KE, Kordasiewicz HB, Wang J, Lewis JW, Posey J, Strange SK, Guzman-Karlsson MC, Phillips SE, Decker K, Motley ST, Swayze EE, Ecker DJ, Michael TP, Day JJ, Sweatt JD. Kennedy AJ, et al. Cell Rep. 2016 Sep 6;16(10):2666-2685. doi: 10.1016/j.celrep.2016.08.004. Epub 2016 Aug 25. Cell Rep. 2016. PMID: 27568567 Free PMC article. - The Role of DNMT Methyltransferases and TET Dioxygenases in the Maintenance of the DNA Methylation Level.
Davletgildeeva AT, Kuznetsov NA. Davletgildeeva AT, et al. Biomolecules. 2024 Sep 4;14(9):1117. doi: 10.3390/biom14091117. Biomolecules. 2024. PMID: 39334883 Free PMC article. Review.
References
- Branco MR, Ficz G, Reik W. Uncovering the role of 5-hydroxymethylcytosine in the epigenome. Nat Rev Genet. 2012;13:7–13. - PubMed
Publication types
MeSH terms
Substances
Grants and funding
- MH091122/MH/NIMH NIH HHS/United States
- ES021957/ES/NIEHS NIH HHS/United States
- R01 MH091122/MH/NIMH NIH HHS/United States
- R37 NS047344/NS/NINDS NIH HHS/United States
- MH57014/MH/NIMH NIH HHS/United States
- NR012686/NR/NINR NIH HHS/United States
- NS07344/NS/NINDS NIH HHS/United States
- R21 ES021957/ES/NIEHS NIH HHS/United States
- R01 NR012686/NR/NINR NIH HHS/United States
- R01 AG031722/AG/NIA NIH HHS/United States
- R01 MH057014/MH/NIMH NIH HHS/United States
LinkOut - more resources
Full Text Sources
Other Literature Sources
Medical


