Evaluation of neurobehavioral and neuroinflammatory end-points in the post-exposure period in rats sub-acutely exposed to manganese - PubMed (original) (raw)
Evaluation of neurobehavioral and neuroinflammatory end-points in the post-exposure period in rats sub-acutely exposed to manganese
Dinamene Santos et al. Toxicology. 2013.
Erratum in
- Toxicology. 2014 Feb 28;316:75. Dinamene, Santos [corrected to Santos, Dinamene]; Camila, Batoreu M [corrected to Batoréu, M Camila]; Luisa, Mateus [corrected to Mateus, M Luísa]; Vanda, Andrade [corrected to Andrade, Vanda]; Ruben, Ramos [corrected to Ramos, Ruben]; Edite, Torres [cor
Abstract
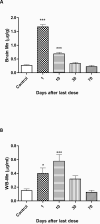
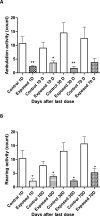
Manganese (Mn) can cause manganism, a neurological disorder similar to Parkinson' Disease (PD). The neurobehavioral and neuroinflammatory end-points in the Mn post exposure period have not been studied yet. Rats were injected on alternate days with 8 doses of MnCl2 (25mg/kg) or saline, then euthanized 1, 10, 30 or 70 days following the last dose. Whole-blood (WB) (p<0.05), urine (p<0.05) and brain cortical (p<0.0001) Mn levels were significantly increased 24h after the last dose. Decreases in the rats' ambulation were noted 1, 10 and 30 days after the last Mn dose (p<0.001; p<0.05; p<0.001, respectively) and also in the rearing activity at the four time-points (p<0.05). Cortical glial fibrillary acid protein immunoreactivity (GFAP-ir) was significantly increased at 1, 10, 30 (p<0.0001) and 70 (p<0.001) days after the last Mn dose, as well as tumor necrosis α (TNF-α) levels (p<0.05) but just on day 1. Taken together, the results show that, during the 70-day clearance phase of Mn, the recovery is not immediate as behavioral alterations and neuroinflammation persist long after Mn is cleared from the cortical brain compartment.
Keywords: GFAP; Manganese neurotoxicity; Neurobehavioral assays; Neuroinflammation; TNF-α.
Copyright © 2013 Elsevier Ireland Ltd. All rights reserved.
Figures
Figure 1
Mn concentrations in rats exposed to 8 doses of MnCl2 (25 mg/Kg, on alternate days) or saline (controls) sacrificed 1, 10, 30 or 70 days after the last dose; Data for each control group were compiled into a single control. (A) brain Mn concentration (n=5); (B) WB-Mn concentrations (n=5); (C) urine Mn concentrations (n=4). Bars represent mean ± SEM (n=5). * p<0.05, *** p<0.0001 indicate statistical difference from control group by one-way ANOVA followed by Bonferroni's multiple comparison tests.
Figure 2
Neurobehavioral evaluation in rats exposed to 8 doses of MnCl2 (25 mg/Kg, on alternate days) or saline (controls) sacrificed 1, 10, 30 or 70 days after the last dose; (A) ambulation, number of crossings in the open field; (B) number of rearings in the open field. Bars represent mean ± SEM (n=5). * p<0.05** p<0.001*** p<0.0001 indicate statistical difference from the control group by one-way ANOVA followed by Bonferroni's multiple comparison tests.
Figure 3
Cortical astrocytic GFAP levels [expressed as relative fluorescence units (RFU)] in rats exposed to 8 doses of MnCl2 (25 mg/Kg, on alternate days) or saline (controls) sacrificed 1, 10, 30 or 70 days after the last dose; Data for each control group were compiled into a single control. Bars represent mean ± SEM (n=3). *** p<0.0001, ** p<0.001 indicate statistical difference from the control by one-way ANOVA followed by Bonferroni's multiple comparison tests.
Figure 4
TNF-α concentrations in rats exposed to 8 doses of MnCl2 (25 mg/Kg, on alternate days) or saline (controls) sacrificed 1, 10, 30 or 70 days after the last dose; Data for each control group were compiled into a single control. Bars represent mean ± SEM (n=5). * p<0.05 indicates statistical difference from control by one-way ANOVA followed by Bonferroni's multiple comparison tests.
Similar articles
- Short-term manganese inhalation decreases brain dopamine transporter levels without disrupting motor skills in rats.
Saputra D, Chang J, Lee BJ, Yoon JH, Kim J, Lee K. Saputra D, et al. J Toxicol Sci. 2016;41(3):391-402. doi: 10.2131/jts.41.391. J Toxicol Sci. 2016. PMID: 27193731 - Neurotoxicity of manganese chloride in neonatal and adult CD rats following subchronic (21-day) high-dose oral exposure.
Dorman DC, Struve MF, Vitarella D, Byerly FL, Goetz J, Miller R. Dorman DC, et al. J Appl Toxicol. 2000 May-Jun;20(3):179-87. doi: 10.1002/(sici)1099-1263(200005/06)20:3<179::aid-jat631>3.0.co;2-c. J Appl Toxicol. 2000. PMID: 10797470 - Oxidative damage and neurodegeneration in manganese-induced neurotoxicity.
Milatovic D, Zaja-Milatovic S, Gupta RC, Yu Y, Aschner M. Milatovic D, et al. Toxicol Appl Pharmacol. 2009 Oct 15;240(2):219-25. doi: 10.1016/j.taap.2009.07.004. Epub 2009 Jul 14. Toxicol Appl Pharmacol. 2009. PMID: 19607852 Free PMC article. - Inflammatory Activation of Microglia and Astrocytes in Manganese Neurotoxicity.
Tjalkens RB, Popichak KA, Kirkley KA. Tjalkens RB, et al. Adv Neurobiol. 2017;18:159-181. doi: 10.1007/978-3-319-60189-2_8. Adv Neurobiol. 2017. PMID: 28889267 Free PMC article. Review. - Manganese in health and disease.
Avila DS, Puntel RL, Aschner M. Avila DS, et al. Met Ions Life Sci. 2013;13:199-227. doi: 10.1007/978-94-007-7500-8_7. Met Ions Life Sci. 2013. PMID: 24470093 Free PMC article. Review.
Cited by
- "Manganese-induced neurotoxicity: a review of its behavioral consequences and neuroprotective strategies".
Peres TV, Schettinger MR, Chen P, Carvalho F, Avila DS, Bowman AB, Aschner M. Peres TV, et al. BMC Pharmacol Toxicol. 2016 Nov 4;17(1):57. doi: 10.1186/s40360-016-0099-0. BMC Pharmacol Toxicol. 2016. PMID: 27814772 Free PMC article. Review. - Occupational Exposure to Manganese and Fine Motor Skills in Elderly Men: Results from the Heinz Nixdorf Recall Study.
Pesch B, Casjens S, Weiss T, Kendzia B, Arendt M, Eisele L, Behrens T, Ulrich N, Pundt N, Marr A, Robens S, Van Thriel C, Van Gelder R, Aschner M, Moebus S, Dragano N, Brüning T, Jöckel KH. Pesch B, et al. Ann Work Expo Health. 2017 Nov 10;61(9):1118-1131. doi: 10.1093/annweh/wxx076. Ann Work Expo Health. 2017. PMID: 29136419 Free PMC article. - Coherent and Contradictory Facts, Feats and Fictions Associated with Metal Accumulation in Parkinson's Disease: Epicenter or Outcome, Yet a Demigod Question.
Rasheed MSU, Tripathi S, Mishra S, Singh MP. Rasheed MSU, et al. Mol Neurobiol. 2017 Aug;54(6):4738-4755. doi: 10.1007/s12035-016-0016-y. Epub 2016 Aug 1. Mol Neurobiol. 2017. PMID: 27480264 Review. - Toxic Exposure to Endocrine Disruptors Worsens Parkinson's Disease Progression through NRF2/HO-1 Alteration.
D'Amico R, Gugliandolo E, Siracusa R, Cordaro M, Genovese T, Peritore AF, Crupi R, Interdonato L, Di Paola D, Cuzzocrea S, Fusco R, Impellizzeri D, Di Paola R. D'Amico R, et al. Biomedicines. 2022 May 5;10(5):1073. doi: 10.3390/biomedicines10051073. Biomedicines. 2022. PMID: 35625810 Free PMC article. - Magnetic resonance imaging to assess the brain response to fasting in glioblastoma-bearing rats as a model of cancer anorexia.
Guadilla I, González S, Cerdán S, Lizarbe B, López-Larrubia P. Guadilla I, et al. Cancer Imaging. 2023 Apr 10;23(1):36. doi: 10.1186/s40644-023-00553-y. Cancer Imaging. 2023. PMID: 37038232 Free PMC article.
References
- Alves G, Thiebot J, Tracqui A, Delangre T, Guedon C, Lerebours E. Neurologic disorders due to brain manganese deposition in a jaundiced patient receiving long-term parenteral nutrition. JPEN J Parenter Enteral Nutr. 1997;21:41–45. - PubMed
- Apostoli P, Lucchini R, Alessio L. Are current biomarkers suitable for the assessment of manganese exposure in individual workers? Am J Ind Med. 2000;37:283–290. - PubMed
- Aschner M. Manganese homeostasis in the CNS. Environ Res. 1999;80:105–109. - PubMed
- Baek SY, Kim YH, Oh SO, Lee CR, Yoo CI, Lee JH, Lee H, Sim CS, Park J, Kim JW, Yoon CS, Kim Y. Manganese does not alter the severe neurotoxicity of MPTP. Hum Exp Toxicol. 2007;26:203–211. - PubMed
- Bertinet DB, Tinivella M, Balzola FA, de Francesco A, Davini O, Rizzo L, Massarenti P, Leonardi MA, Balzola F. Brain manganese deposition and blood levels in patients undergoing home parenteral nutrition. JPEN J Parenter Enteral Nutr. 2000;24:223–227. - PubMed
Publication types
MeSH terms
Substances
LinkOut - more resources
Full Text Sources
Other Literature Sources
Miscellaneous


