Single-cell Hi-C reveals cell-to-cell variability in chromosome structure - PubMed (original) (raw)
Single-cell Hi-C reveals cell-to-cell variability in chromosome structure
Takashi Nagano et al. Nature. 2013.
Abstract
Large-scale chromosome structure and spatial nuclear arrangement have been linked to control of gene expression and DNA replication and repair. Genomic techniques based on chromosome conformation capture (3C) assess contacts for millions of loci simultaneously, but do so by averaging chromosome conformations from millions of nuclei. Here we introduce single-cell Hi-C, combined with genome-wide statistical analysis and structural modelling of single-copy X chromosomes, to show that individual chromosomes maintain domain organization at the megabase scale, but show variable cell-to-cell chromosome structures at larger scales. Despite this structural stochasticity, localization of active gene domains to boundaries of chromosome territories is a hallmark of chromosomal conformation. Single-cell Hi-C data bridge current gaps between genomics and microscopy studies of chromosomes, demonstrating how modular organization underlies dynamic chromosome structure, and how this structure is probabilistically linked with genome activity patterns.
Figures
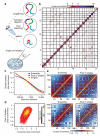
Figure 1. Single cell and ensemble Hi-C
a, Single cell Hi-C method. b, Single cell Hi-C heatmap (cell-5), coverage for 10 Mb bins. c, Contact enrichment versus genomic distance, from ensemble Hi-C, pool of 60 single cells and 10 individual cells, scaled to normalise sequencing depths. d, Normalising by the trends in c, intra-chromosomal contact enrichments for 1 Mb square bins, comparing ensemble and pooled single cell Hi-C (Spearman correlation = 0.56). e, Intra-chromosomal contact enrichment maps of ensemble and pooled single cell Hi-C, for chromosome 10 (top) and chromosome 2 (bottom), using variable bin sizes.
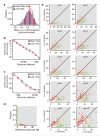
Figure 2. Conserved intra-domain, but not inter-domain structure in single cells
a, Individual intra-chromosomal contacts of 50 Mb region of chromosome 2 up to 3 Mb distance (blue dots), domains (grey). b, Ratios between intra-domain and inter-domain contact enrichments over genomic distance. Control is combined trend of 10 single cells calculated by repeatedly shifting the domains randomly. c, Distribution of intra-domain contact enrichments per domain from 9 cells (where Bgl II was used) and reshuffled datasets (black bars, standard errors). d, Maps of inter-domain contacts intensities for chromosome 2 from individual cells and reshuffled controls using variable bin sizes. e, Distribution of percentage of loci with high insulation scores in single vs. reshuffled cells. f, For all pairs of single cells, the correlations between inter-domain contact numbers of all pairs of domains within the same chromosome were computed. Shown are the distributions of these correlations in the real and reshuffled cells.
Figure 3. Structural modeling of X chromosomes
a, Distribution of longest diameter of X chromosome paint DNA FISH signals in 62 male Th1 cells (real), 200 structural models calculated for each single cell (cell-1 to -9), 200 structures from combined dataset (cell-1 and -2; comb) and 200 structures from 20 randomised cell-1 datasets (random; 10 calculations per dataset). Whiskers denote minimum and maximum. b, Average coordinate root-mean-square deviation (RMSD) values in microns comparing 200 low-resolution structural models for each cell and between cells. c, Four surface-rendered models of the X chromosome from cell-1, which are most representative of the data based on hierarchical clustering of pair-wise RMSD values (Supplementary Information). Scale bar, 1 μm. d, Structural ensembles of the four most representative fine-scale models for cell-1 and cell-6, with four large regions coloured. Scale bar, 1 μm. e, Mean structural density rank for 500 kb regions (black) from 6 × 200 fine-scale models from cell-1 to -6. Standard deviation (blue/pink). Abundance of intra-chromosomal restraints (grey, right axis). DNA FISH probes (P1-P5) are indicated. f, DNA FISH on Th1 cells. X chromosome paint (green) and specific locus signals (red). g, Distribution of DNA FISH distance measurements between signal centres for probes P1 - P5 and edge of the X chromosome territory in Th1 cells (n = 114, 113, 105, 115, 108 for P1-P5). Whiskers denote 10 and 90 percentiles. h, Enrichment of _cis_-, _trans_-contacts and Lamin-B1 associated domains at various depths on the chromosome models relative to null hypothesis of random positions.
Figure 4. Active domains localise to territory interfaces
a, Distribution of _trans_-chromosomal contact enrichments of each domain averaged across real and reshuffled cells. Reshuffling maintains the number of cis and trans contacts within each cell and chromosome. b, Intra-domain contact enrichment over genomic distance for high vs. low _trans_-chromosomal contacting domains selected independently in each cell, with 95% confidence intervals. c, Same sets as in b but plotting the enrichment of inter-domain contacts. d, Distribution of H3K4me3 peak density in domains (number of peaks divided by size), color-coded according to density. e, Domains plotted according to number of _trans_- and _cis_-chromosomal (excluding intra-domain) contacts, color coded for H3K4me3 density as in d.
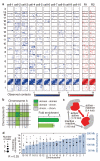
Figure 5. Chromosomal interfaces
a, All _trans_-chromosomal contacts formed by chromosome 2 in real cells (blue) and reshuffled (red). b, Schematic diagram of a chromosomal interface between linearly adjacent domains, their borders marked in black on two chromosomes, A and B. We considered each of the two contacting fragments of every _trans_-chromosomal contact and classified every nearby _trans_-chromosomal contact as domain-domain, domain-chromosome and chromosome-chromosome, the latter being used as background for normalisation (Supplementary Information). Contact under consideration (red), nearby contacts (blue). Fold enrichments shown for each group type (error bars, standard deviation). c, _Trans_-chromosomal contacts are highly significantly enriched between active domains (H3K4me3 enriched) or between inactive domains, but not mixed interaction (chi-square test; p = 5.8e-18; even after taking account of the generally higher connectivity of active domains). d, Bar graph depicting mouse autosomes ordered by size with number of interacting chromosomes per single cell (black circles depict the distribution over individual cells). Mean number of interacting chromosomes changes modestly (30%) with chromosome size, suggesting a highly organized territory structure with surface that is not scaling with chromosome length.
Comment in
- Biological techniques: Chromosomes captured one by one.
Dekker J, Mirny L. Dekker J, et al. Nature. 2013 Oct 3;502(7469):45-6. doi: 10.1038/nature12691. Epub 2013 Sep 25. Nature. 2013. PMID: 24067607 No abstract available. - Finding function in the folds.
Eisenstein M. Eisenstein M. Nat Methods. 2013 Nov;10(11):1052-3. doi: 10.1038/nmeth.2716. Nat Methods. 2013. PMID: 24344379 No abstract available.
Similar articles
- Hi-C: a method to study the three-dimensional architecture of genomes.
van Berkum NL, Lieberman-Aiden E, Williams L, Imakaev M, Gnirke A, Mirny LA, Dekker J, Lander ES. van Berkum NL, et al. J Vis Exp. 2010 May 6;(39):1869. doi: 10.3791/1869. J Vis Exp. 2010. PMID: 20461051 Free PMC article. - Chromatin Conformation Capture-Based Analysis of Nuclear Architecture.
Grob S, Grossniklaus U. Grob S, et al. Methods Mol Biol. 2017;1456:15-32. doi: 10.1007/978-1-4899-7708-3_2. Methods Mol Biol. 2017. PMID: 27770354 - A (3D-Nuclear) Space Odyssey: Making Sense of Hi-C Maps.
Mota-Gómez I, Lupiáñez DG. Mota-Gómez I, et al. Genes (Basel). 2019 May 29;10(6):415. doi: 10.3390/genes10060415. Genes (Basel). 2019. PMID: 31146487 Free PMC article. Review. - Chromosome organization in the nucleus - charting new territory across the Hi-Cs.
Dostie J, Bickmore WA. Dostie J, et al. Curr Opin Genet Dev. 2012 Apr;22(2):125-31. doi: 10.1016/j.gde.2011.12.006. Epub 2012 Jan 19. Curr Opin Genet Dev. 2012. PMID: 22265226 Review. - Capturing Three-Dimensional Genome Organization in Individual Cells by Single-Cell Hi-C.
Nagano T, Wingett SW, Fraser P. Nagano T, et al. Methods Mol Biol. 2017;1654:79-97. doi: 10.1007/978-1-4939-7231-9_6. Methods Mol Biol. 2017. PMID: 28986784
Cited by
- Chromatin tracing and multiplexed imaging of nucleome architectures (MINA) and RNAs in single mammalian cells and tissue.
Liu M, Yang B, Hu M, Radda JSD, Chen Y, Jin S, Cheng Y, Wang S. Liu M, et al. Nat Protoc. 2021 May;16(5):2667-2697. doi: 10.1038/s41596-021-00518-0. Epub 2021 Apr 26. Nat Protoc. 2021. PMID: 33903756 Free PMC article. - CRISPRthripsis: The Risk of CRISPR/Cas9-induced Chromothripsis in Gene Therapy.
Amendola M, Brusson M, Miccio A. Amendola M, et al. Stem Cells Transl Med. 2022 Oct 21;11(10):1003-1009. doi: 10.1093/stcltm/szac064. Stem Cells Transl Med. 2022. PMID: 36048170 Free PMC article. - Single-cell gene expression profiling and cell state dynamics: collecting data, correlating data points and connecting the dots.
Marr C, Zhou JX, Huang S. Marr C, et al. Curr Opin Biotechnol. 2016 Jun;39:207-214. doi: 10.1016/j.copbio.2016.04.015. Epub 2016 May 23. Curr Opin Biotechnol. 2016. PMID: 27152696 Free PMC article. Review. - Cohesin promotes stochastic domain intermingling to ensure proper regulation of boundary-proximal genes.
Luppino JM, Park DS, Nguyen SC, Lan Y, Xu Z, Yunker R, Joyce EF. Luppino JM, et al. Nat Genet. 2020 Aug;52(8):840-848. doi: 10.1038/s41588-020-0647-9. Epub 2020 Jun 22. Nat Genet. 2020. PMID: 32572210 Free PMC article. - Broadening our understanding of the genetics of Juvenile Idiopathic Arthritis (JIA): Interrogation of three dimensional chromatin structures and genetic regulatory elements within JIA-associated risk loci.
Jiang K, Kessler H, Park Y, Sudman M, Thompson SD, Jarvis JN. Jiang K, et al. PLoS One. 2020 Jul 30;15(7):e0235857. doi: 10.1371/journal.pone.0235857. eCollection 2020. PLoS One. 2020. PMID: 32730263 Free PMC article.
References
- Dekker J, Rippe K, Dekker M, Kleckner N. Capturing chromosome conformation. Science. 2002;295:1306–11. - PubMed
- Simonis M, et al. Nuclear organization of active and inactive chromatin domains uncovered by chromosome conformation capture-on-chip (4C) Nat Genet. 2006;38:1348–54. - PubMed
Publication types
MeSH terms
Substances
Grants and funding
- G117/530/MRC_/Medical Research Council/United Kingdom
- BBS/E/B/0000M241/BB_/Biotechnology and Biological Sciences Research Council/United Kingdom
- WT_/Wellcome Trust/United Kingdom
- BBS/E/B/000C0404/BB_/Biotechnology and Biological Sciences Research Council/United Kingdom
- G0800036/MRC_/Medical Research Council/United Kingdom
- BBS/E/B/0000C151/BB_/Biotechnology and Biological Sciences Research Council/United Kingdom
LinkOut - more resources
Full Text Sources
Other Literature Sources
Molecular Biology Databases


