Stroke-induced brain parenchymal injury drives blood-brain barrier early leakage kinetics: a combined in vivo/in vitro study - PubMed (original) (raw)
Stroke-induced brain parenchymal injury drives blood-brain barrier early leakage kinetics: a combined in vivo/in vitro study
Mélanie Kuntz et al. J Cereb Blood Flow Metab. 2014 Jan.
Abstract
The disappointing clinical outcomes of neuroprotectants challenge the relevance of preclinical stroke models and data in defining early cerebrovascular events as potential therapeutic targets. The kinetics of blood-brain barrier (BBB) leakage after reperfusion and the link with parenchymal lesion remain debated. By using in vivo and in vitro approaches, we conducted a kinetic analysis of BBB dysfunction during early reperfusion. After 60 minutes of middle cerebral artery occlusion followed by reperfusion times up to 24 hours in mice, a non-invasive magnetic resonance imaging method, through an original sequence of diffusion-weighted imaging, determined brain water mobility in microvascular compartments (D*) apart from parenchymal compartments (apparent diffusion coefficient). An increase in D* found at 4 hours post reperfusion concurred with the onset of both Evans blue/Dextran extravasations and in vitro BBB opening under oxygen-glucose deprivation and reoxygenation (R). The BBB leakage coincided with an emerging cell death in brain tissue as well as in activated glial cells in vitro. The co-culture of BBB endothelial and glial cells evidenced a recovery of endothelium tightness when glial cells were absent or non-injured during R. Preserving the ischemic brain parenchymal cells within 4 hours of reperfusion may improve therapeutic strategies for cerebrovascular protection against stroke.
Figures
Figure 1
Diffusion data set analysis. The diffusion sequence parameters were modified by expanding the number of b values (6 values ranging from 0 to 100 seconds/mm2 and 5 values ranging from 100 to 1000 seconds/mm2) to optimize the calculation, within regions of interest (1 to 4, open circles), of water mobility for both microvessels (D*) and brain tissue (apparent diffusion coefficient). From diffusion data sets, the bi-exponential fit model was applied to the signal decay as a function of the ultrastructural constraint related to diffusion gradients (b values): 0<b value<100 seconds/mm2 for the microvascular diffusion component and 100<b value<1000 seconds/mm2 for the brain tissue diffusion component. ADC, apparent diffusion coefficient.
Figure 2
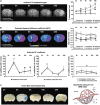
Postischemic modifications of brain water status. (A) Time course of brain tissue water content. Assessment of magnetic resonance imaging quantitative parameters during reperfusion (2, 4, 8, 16, and 24 hours post occlusion) including T2-weighted (tissue water content) imaging. The tissue water content (T2r) is expressed as the mean±s.e.m. tissue relaxation time (ms) calculated for contralateral (open symbols) and ipsilateral (closed symbols) regions of interest (ROIs) in the cortex (circles) and in the subcortex (triangles). The mean scores were significantly different according to a two-way analysis of variance (ANOVA) and subsequent Bonferroni post hoc tests: ipsilateral versus contralateral cortex for each reperfusion time §P<0.05, §§P<0.01, and §§§P<0.001; ipsilateral versus contralateral subcortex for each reperfusion time ***P<0.001 (2 hours: _n_=7; 4 hours: _n_=7; 8 hours: n_=8; 16 hours: n_=6; 24 hours: n_=9). (B) Time course of tissue water mobility. Diffusion-weighted imaging assessed random motion of water molecules in the brain. Both apparent diffusion coefficients (ADC) and D* were extracted from bi-exponential fits and are expressed as the mean±s.e.m. (.10−3 mm2/second) for contralateral (open symbols) and ipsilateral (closed symbols) ROIs of the cortex (circles) and the subcortex (triangles). Apparent diffusion coefficient values were significantly different according to a two-way ANOVA and subsequent Bonferroni post hoc tests: ipsilateral versus contralateral cortex for each reperfusion time §_P<0.05, §§_P<0.01, and §§§_P<0.001; ipsilateral versus contralateral subcortex for each reperfusion time **P<0.01 and ***P<0.001 (2 hours: _n_=7; 4 hours: _n_=7; 8 hours: _n_=8; 16 hours: n_=6; 24 hours: n_=9). Reperfusion time points of cortical D* coefficients (left panel) were significantly different according to a two-way ANOVA and subsequent Bonferroni post hoc tests: ipsilateral cortex D* at 4 hours versus each other time point (§_P<0.05 and §§_P<0.01). The multiple comparison between each D* coefficient in subcortex area showed no difference (middle panel; NS: non-significant). No difference was found in the contralateral cortical and subcortical areas (right panel). (C) Time course of blood–brain barrier (BBB) leakage. Representative brain slices from Evans blue-infused animals (correspondence with ADC maps shown in panel B) at each reperfusion time point. Extravasation of Evans blue in the ipsilateral brain area was found clearly visible at 4 hours of reperfusion, compared with the next reperfusion times. The right panel displays a schematic model of the possible link between the microvascular component of the dynamic water distribution (D*) and the BBB leakage. When the BBB starts to leak after ischemia/reperfusion (‘leaky'), water molecules still circulate within the vessels (jagged arrows) but the transcapillary filtration rate is also much enhanced (dotted arrows), leading to an increase in D* and then T2r because water enters the brain parenchyma.
Figure 3
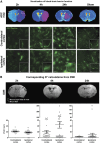
Heterogeneity in microvascular water mobility (D*) and blood–brain barrier (BBB) leakage. (A) Visualization of BBB function. Apparent diffusion coefficient maps were drawn to localize brain infarction for each reperfusion time: 2 hours (_n_=4), 4 hours (_n_=4), and 24 hours (_n_=3). Brain slices from fluorescein isothiocyanate (FITC)-Dextran-infused animals illustrate the different states of BBB function in contralateral and ipsilateral cortices observed (scale bar, 50 _μ_m) from indicated fields of view (square windows). Extravasation of fluorescein isothiocyanate (FITC)-Dextran was clearly visible through a blurred fluorescence signal alongside the capillary segments at 4 hours and 24 hours of reperfusion. No extravasation was observed in hemispheres of 24-hour sham-operated animals. Magnified images (inner windows) illustrate typical morphology of capillaries in each field of view, as revealed by intravascular FITC-Dextran (for tight capillaries) or extravasated FITC-Dextran alongside the leaky capillaries (scale bar, 10 _μ_m). (B) D* calculations from diffusion-weighted imaging (DWI). As a case study, within each microscope field of view (rectangles), 72 micro-regions of interest (ROIs) (circles) were defined in six zones along the cortex (contralateral: 3; ipsilateral: 3). In each zone, 12 micro-ROIs were drawn. Results in vertical scatter plots give the heterogeneous repartition of D* values at each reperfusion time (2, 4, and 24 hours).
Figure 4
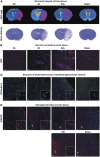
Lesional status of ischemic brain tissue and blood–brain barrier cells. (A) Structural integrity of brain tissue. After the determination of brain lesions through the drawing of apparent diffusion coefficient (ADC) maps, tissue damage was visualized by Cresyl violet staining in sham or ischemic animals after 2 hours, 4 hours, or 24 hours of reperfusion. (B) Necrotic cell death in brain tissue. Brain cell necrosis was assessed in sham or ischemic animals after 2 hours (_n_=4), 4 hours (_n_=3), or 24 hours (_n_=3) of reperfusion, by double nuclear staining: Hoechst 33258 (blue) stained all cells, and propidium iodide (PI, red) stained dead cells. Scale bar, 50 _μ_m. In an inner window, a magnified image of Hoechst/PI-stained nuclei (scale bar, 5 _μ_m). (C) Structure of blood–brain barrier endothelial tight junction network. Immunostaining of Claudin-5 tight junction protein was performed in sham or ischemic animals after 2 hours (_n_=2), 4 hours (_n_=2) or 24 hours (_n_=2) of reperfusion. Nuclei were stained by Hoechst 33258 (blue). Scale bar, 100 _μ_m. In inner windows, a magnified typical image shows continuous Claudin-5 network (scale bar, 5 _μ_m). (D) Astroglial activation in brain tissue. Immunostaining of glial fibrillary acidic protein (GFAP) was performed in sham or ischemic animals after 2 hours (_n_=2), 4 hours (_n_=2), 24 hours (_n_=2) or 72 hours (_n_=3) of reperfusion. Nuclei were stained by Hoechst 33258 (blue). Scale bar, 100 _μ_m. In the inner windows, a magnified image shows the rare astroglial cells activated in the cortex (scale bar, 5 _μ_m). The corpus callosum is indicated by an asterisk. H: Hoechst. In panels B, C, D, merged images of ipsilateral cortex are represented.
Figure 5
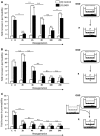
Blood–brain barrier response to oxygen-glucose deprivation (OGD)–reoxygenation in vitro. The permeability of a mouse brain capillary endothelial cells (MBCEC) monolayer to Lucifer Yellow (LY) after incubation of the co-culture for 4 hours under normoxic conditions (open bars) or OGD conditions (filled bars), followed by 2 hours, 4 hours, 8 hours, 16 hours, or 24 hours of reoxygenation (A). In other experiments, glial cells (GCs) were removed during reoxygenation (B) or replaced by GCs derived from a co-culture that had not been submitted to OGD (C). The results are presented as the mean fold-increase versus control±s.e.m. The control permeability corresponds to a Pe value of 0.34 × 10⁻³ cm/minute (A), 0.24 × 10⁻³ cm/minute (B), and 0.34 × 10⁻³ cm/minute (C) for LY after 4 hours of normoxia. Culture medium renewal during reoxygenation did not alter the baseline permeability under control conditions. The mean scores were significantly different, according to a two-way analysis of variance and subsequent Bonferroni post hoc tests. *P<0.05, **P<0.01, ***P<0.001 (_n_=9 endothelial cell (EC) monolayers per treatment (A–C) and _n_=6 EC monolayers per treatment (B)). NS, non-significant, C, control, R, reoxygenation.
Figure 6
In vitro post oxygen-glucose deprivation(OGD)/reoxygenation (R) glial cell (GC) lesional status. Glial cell necrosis was assessed by double nuclear staining: Hoechst 33258 (blue, left-handed lane) stained all cells, and propidium iodide (PI) (red, middle lane) stained dead cells, and merged images on the next lane to the right. Astrocyte morphology was observed by glial fibrillary acidic protein (GFAP) staining (right-handed lane). This experiment was completed by a measurement of activity of the lactate dehydrogenase (LDH) released into the culture medium (_n_=9). The death rate under normoxic or OGD conditions is expressed as a percentage of a totally lysed GC well (full kill) and indicated in the top, right-hand corner of images. Cell death was observed with either method. Images are representative of cell populations under each set of experimental conditions. Scale bar, 25 _μ_m.
Figure 7
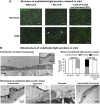
Analysis of tight junction (TJ) integrity in blood–brain barrier endothelial cells in vitro. (A) Structure of endothelial tight junction network in vitro. Immunostaining of Claudin-5 (Green) after 4 hours of normoxia or oxygen-glucose deprivation (OGD) (left-handed lane), followed by 24 hours of reoxygenation with ischemic glial cells (GCs) (reoxygenation (R), middle lane) or non-ischemic GCs (right-handed lane). Interruptions in the staining are indicated by white arrows and were observed only after 24 hours of R with ischemic GCs. Nuclei are stained with Hoechst (blue). Scale bar, 50 _μ_m. (B) Ultrastructure of endothelial tight junctions in vitro. Transmission electron microscopy observations were performed after wheat germ agglutinin-conjugated horseradish peroxidase (WGA-HRP) incubation to account for TJ function. The morphology of the endothelial cell (EC) monolayer as grown on filter inserts (filter) in normoxic control conditions is presented in the top left panel. Two endothelial cells, (EC1 and EC2) are shown, with a magnified view of the TJ in the top right corner of the picture. The different TJ states observed from EC monolayers in normoxic or OGD-R conditions are presented in the lower panel, and the ones for both early onset OGD and late (after 24 hours of R) blood–brain barrier (BBB) openings are rated in the histograms in the top right panel, compared with tight BBB conditions when in normoxia or after 24 hours of R in the presence of non-ischemic GCs, respectively. When the TJ was functional, WGA-HRP (black stain) could not diffuse between the cells (arrowhead) and the junction was considered as impermeable. The picture was obtained from a monolayer after 4 hours of normoxia, and is representative of impermeable junctions observed in endothelial monolayers under normoxia, or under 4 hours of OGD. In contrast, non-functional (i.e. permeable) TJs allowed the WGA-HRP to penetrate through the inter-endothelial cleft and to reach the EC abluminal membrane (black arrow). The picture was obtained from a monolayer after 4 hours of OGD, and is representative of permeable junctions observed in endothelial monolayers under 4 hours of OGD followed or not by 24 hours of R. In the worst case, after 24 hours of R, physical separation of the ECs corresponded to a disrupted junction. The picture was obtained from a monolayer after 4 hours of OGD followed by 24 hours of R, and is representative of disrupted junctions observed only in this condition. When the ECs were incubated with non-ischemic GCs during R, the recovered ECs displayed impermeable TJs. The picture was obtained from a monolayer after 4 hours of OGD followed by 24 hours of R with non-ischemic GCs, and is representative of impermeable TJs observed in this condition. The EC luminal side is indicated by an asterisk.
Similar articles
- Endothelial Conditional Knockdown of NMMHC IIA (Nonmuscle Myosin Heavy Chain IIA) Attenuates Blood-Brain Barrier Damage During Ischemia-Reperfusion Injury.
Gong S, Cao G, Li F, Chen Z, Pan X, Ma H, Zhang Y, Yu B, Kou J. Gong S, et al. Stroke. 2021 Mar;52(3):1053-1064. doi: 10.1161/STROKEAHA.120.031410. Epub 2021 Feb 16. Stroke. 2021. PMID: 33588591 - Peroxisome-proliferator-activated receptor-alpha activation protects brain capillary endothelial cells from oxygen-glucose deprivation-induced hyperpermeability in the blood-brain barrier.
Mysiorek C, Culot M, Dehouck L, Derudas B, Staels B, Bordet R, Cecchelli R, Fenart L, Berezowski V. Mysiorek C, et al. Curr Neurovasc Res. 2009 Aug;6(3):181-93. doi: 10.2174/156720209788970081. Epub 2009 Aug 1. Curr Neurovasc Res. 2009. PMID: 19534718 - Transient oxygen-glucose deprivation sensitizes brain capillary endothelial cells to rtPA at 4h of reoxygenation.
Kuntz M, Mysiorek C, Pétrault O, Boucau MC, Aijjou R, Uzbekov R, Bérézowski V. Kuntz M, et al. Microvasc Res. 2014 Jan;91:44-57. doi: 10.1016/j.mvr.2013.12.002. Epub 2013 Dec 12. Microvasc Res. 2014. PMID: 24333620 - NADPH oxidase plays a central role in blood-brain barrier damage in experimental stroke.
Kahles T, Luedike P, Endres M, Galla HJ, Steinmetz H, Busse R, Neumann-Haefelin T, Brandes RP. Kahles T, et al. Stroke. 2007 Nov;38(11):3000-6. doi: 10.1161/STROKEAHA.107.489765. Epub 2007 Oct 4. Stroke. 2007. PMID: 17916764 - Mitochondrial crisis in cerebrovascular endothelial cells opens the blood-brain barrier.
Doll DN, Hu H, Sun J, Lewis SE, Simpkins JW, Ren X. Doll DN, et al. Stroke. 2015 Jun;46(6):1681-9. doi: 10.1161/STROKEAHA.115.009099. Epub 2015 Apr 28. Stroke. 2015. PMID: 25922503 Free PMC article.
Cited by
- PPAR-Alpha Agonist Used at the Acute Phase of Experimental Ischemic Stroke Reduces Occurrence of Thrombolysis-Induced Hemorrhage in Rats.
Gautier S, Ouk T, Pétrault M, Pétrault O, Bérézowski V, Bordet R. Gautier S, et al. PPAR Res. 2015;2015:246329. doi: 10.1155/2015/246329. Epub 2015 May 27. PPAR Res. 2015. PMID: 26106408 Free PMC article. - Oxygen-Glucose Deprivation/Reoxygenation-Induced Barrier Disruption at the Human Blood-Brain Barrier is Partially Mediated Through the HIF-1 Pathway.
Page S, Raut S, Al-Ahmad A. Page S, et al. Neuromolecular Med. 2019 Dec;21(4):414-431. doi: 10.1007/s12017-019-08531-z. Epub 2019 Mar 26. Neuromolecular Med. 2019. PMID: 30911877 - Classification of Microglial Morphological Phenotypes Using Machine Learning.
Leyh J, Paeschke S, Mages B, Michalski D, Nowicki M, Bechmann I, Winter K. Leyh J, et al. Front Cell Neurosci. 2021 Jun 29;15:701673. doi: 10.3389/fncel.2021.701673. eCollection 2021. Front Cell Neurosci. 2021. PMID: 34267628 Free PMC article. - Bystander Effect Fuels Human Induced Pluripotent Stem Cell-Derived Neural Stem Cells to Quickly Attenuate Early Stage Neurological Deficits After Stroke.
Eckert A, Huang L, Gonzalez R, Kim HS, Hamblin MH, Lee JP. Eckert A, et al. Stem Cells Transl Med. 2015 Jul;4(7):841-51. doi: 10.5966/sctm.2014-0184. Epub 2015 May 29. Stem Cells Transl Med. 2015. PMID: 26025980 Free PMC article. - Microfluidic blood-brain barrier model provides in vivo-like barrier properties for drug permeability screening.
Wang YI, Abaci HE, Shuler ML. Wang YI, et al. Biotechnol Bioeng. 2017 Jan;114(1):184-194. doi: 10.1002/bit.26045. Epub 2016 Jul 21. Biotechnol Bioeng. 2017. PMID: 27399645 Free PMC article.
References
- Dirnagl U, Iadecola C, Moskowitz MA. Pathobiology of ischaemic stroke: an integrated view. Trends Neurosci. 1999;22:391–397. - PubMed
- O'Collins VE, Macleod MR, Donnan GA, Horky LL, van der Worp BH, Howells DW. 1,026 experimental treatments in acute stroke. Ann Neurol. 2006;59:467–477. - PubMed
- Mehra M, Henninger N, Hirsch JA, Chueh J, Wakhloo AK, Gounis MJ. Preclinical acute ischemic stroke modeling. J Neurointerv Surg. 2012;4:307–313. - PubMed
- Rosenberg N, Chen M, Prabhakaran S. New devices for treating acute ischemic stroke. Recent Pat CNS Drug Discov. 2010;5:118–134. - PubMed
Publication types
MeSH terms
Substances
LinkOut - more resources
Full Text Sources
Other Literature Sources
Medical

