Lipid-anchored SNAREs lacking transmembrane regions fully support membrane fusion during neurotransmitter release - PubMed (original) (raw)
Lipid-anchored SNAREs lacking transmembrane regions fully support membrane fusion during neurotransmitter release
Peng Zhou et al. Neuron. 2013.
Abstract
Synaptic vesicle fusion during neurotransmitter release is mediated by assembly of SNARE- and SM-protein complexes composed of syntaxin-1, SNAP-25, synaptobrevin-2/VAMP2, and Munc18-1. Current models suggest that SNARE-complex assembly catalyzes membrane fusion by pulling the transmembrane regions (TMRs) of SNARE proteins together, thus allowing their TMRs to form a fusion pore. These models are consistent with the requirement for TMRs in viral fusion proteins. However, the role of the SNARE TMRs in synaptic vesicle fusion has not yet been tested physiologically. Here, we examined whether synaptic SNAREs require TMRs for catalysis of synaptic vesicle fusion, which was monitored electrophysiologically at millisecond time resolution. Surprisingly, we find that both lipid-anchored syntaxin-1 and lipid-anchored synaptobrevin-2 lacking TMRs efficiently promoted spontaneous and Ca(2+)-triggered membrane fusion. Our data suggest that SNARE proteins function during fusion primarily as force generators, consistent with the notion that forcing lipid membranes close together suffices to induce membrane fusion.
Copyright © 2013 Elsevier Inc. All rights reserved.
Figures
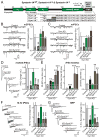
Figure 1. Tight coupling of syntaxin-1 SNARE motif and TMR is essential for Ca2+- and hypertonic sucrose-triggered synaptic vesicle fusion, but not for spontaneous fusion
A, Domain structure and C-terminal sequences of wild-type (Synt1AWT) and mutant syntaxin-1A with 3-residue (Synt1A3i) or 7-residue (Synt1A7i) insertions between the SNARE motif and TMR B & C, Representative traces (left) and summary graphs of the frequency (right) of miniature excitatory (mEPSCs; B) and miniature inhibitory postsynaptic currents (mIPSCs; C) in cortical neurons cultured from syntaxin-1A KO mice and infected with control lentivirus (Control), or lentiviruses expressing only syntaxin-1 shRNAs (−), or syntaxin shRNAs together with shRNA-resistant wild-type (Synt1AWT) or shRNA-resistant mutant syntaxin-1A with a 3- (Synt1A3i) or 7-residue insertion (Synt1A7i). mEPSCs and mIPSCs were recorded in 1 μM TTX and either 50 μM picrotoxin (mEPSCs) or 10 μM CNQX and 50μM AP-5 (mIPSCs). D, Representative traces (left) and summary graphs of the charge transfer (right) of inhibitory postsynaptic currents (IPSCs) evoked by isolated action potentials, monitored in cortical neurons as described for panel C but without TTX. E, Summary graphs of the IPSC rise times (left), and the variability of IPSC rise times expressed as the standard deviation (SD; middle) and the coefficient of variation (c.v.; right) of these rise times. F, Representative traces (left) and summary graphs of the total synaptic charge transfer (right) of IPSCs evoked by 10 stimuli applied at 10 Hz, monitored in cortical neurons as described for panel D. G, Representative traces (left) and summary graphs of the total synaptic charge transfer (right) of IPSCs evoked by a 30 s application of 0.5 M hypertonic sucrose to induce exocytosis of the readily-releasable pool of vesicles (RRP), monitored in cortical neurons as described for panel B. Data shown in summary graphs are means ± SEM; numbers of cells/independent cultures analyzed are listed in the bars. Statistical assessments were performed by Student’s t-test comparing each condition to the control (*, p<0.05; **, p<0.01; ***, p<0.001). For additional data, see Figs. S1 and S2.
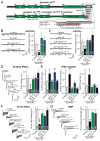
Figure 2. Syntaxin-1 TMR is not essential for synaptic vesicle fusion
A, Domain structures of wild-type (top) and mutant syntaxin-1A in which the TMR replaced by a lipid-anchor sequence derived from syntaxin-19 (bottom; Synt1AΔTMR). The sequences below the diagram depict the critical C-terminal region of wild-type and lipid-anchored syntaxin-1A. The position in lipid-anchored syntaxin-1A at which 7–21 amino acid insertions were placed is indicated by the arrow. B & C, Representative traces (left) and summary graphs of the frequency (right) of mEPSCs (B) and mIPSCs (C) in cortical neurons cultured from syntaxin-1A KO mice and infected with control lentivirus (Control), or lentiviruses expressing only syntaxin-1 shRNAs (−), or co-expressing the syntaxin shRNAs with wild-type syntaxin-1A (S1AWT) or lipid-anchored syntaxin-1A without (S1AΔTMR) or with a 7-residue insertion (S1AΔTMR+7i). D, Representative traces (left) and summary graphs of the charge transfer (right) of IPSCs evoked by isolated action potentials, monitored in cortical neurons as described for C. E, Summary graphs of the IPSC rise times (left), and variability of IPSC rise times expressed as the SD (middle) and the c.v. (right) of rise times as a measure of the desynchronization of release. F, Representative traces (left) and summary graphs of the total synaptic charge transfer (right) of IPSCs evoked by 10 stimuli applied at 10 Hz, monitored in cortical neurons as described for panel C. G, Representative traces (left) and summary graphs of the total synaptic charge transfer (right) of IPSCs evoked by a 30 s application of 0.5 M hypertonic sucrose to induce exocytosis of the readily-releasable pool of vesicles (RRP), monitored in cortical neurons as described for panel B. Data shown in summary graphs are means ± SEMs; numbers of cells/independent cultures analyzed are listed in the bars. Statistical assessments were performed by Student’s t-test comparing a condition to the control (*, p<0.05; **, p<0.01; ***, p<0.001). For additional data, see Fig. S3.
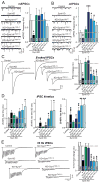
Figure 3. Tight coupling of syntaxin-1 SNARE motif to the lipid anchor is essential for evoked synaptic vesicle fusion, but not for spontaneous fusion
A & B, Representative traces (left) and summary graphs of the frequency (right) of mEPSCs (A) and mIPSCs (B) in cortical neurons cultured from syntaxin-1A KO mice. Neurons were infected with control lentivirus (Control), or lentiviruses expressing only syntaxin-1 shRNAs (−), or co-expressing syntaxin shRNAs together with shRNA-resistant wild-type (Synt1AWT) or shRNA-resistant mutant syntaxin-1A with a lipid anchor instead of a TMR and insertions of 7 residues (Synt1AΔTMR+7i), 10 residues (Synt1AΔTMR+10i), 14 residues (Synt1AΔTMR+14i), and 21 residues (Synt1AΔTMR+21i). For insertion and flanking sequences, see Figs. 2A and S4). C, Representative traces (left) and summary graphs of the charge transfer (right) of IPSCs evoked by isolated action potentials, monitored in cortical neurons as described for panels A and B. D, Summary graphs of the IPSC rise times (left), and the variability of IPSC rise times expressed as the standard deviation (SD; middle) and the coefficient of variation (c.v.; right) of these rise times. E, Representative traces (left) and summary graphs of the total synaptic charge transfer (right) of IPSCs evoked by 10 stimuli applied at 10 Hz, monitored in cortical neurons as described for panels A and B. Data shown in summary graphs are means ± SEM; numbers of cells/independent cultures analyzed are listed in the bars. Statistical assessments were performed by Student’s t-test comparing each condition to control (*, p<0.05; **, p<0.01; ***, p<0.001).
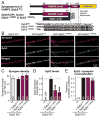
Figure 4. Construction of lipid-anchored synaptobrevin-2/VAMP2 that is still targeted to synapses
A, Domain structures and C-terminal sequences of wild-type synaptobrevin-2 fused to mVenus (top; Syb2WT), and mutant synaptobrevin-2 in which the TMR is replaced with the C-terminal region of CSPα (bottom), fused to synaptobrevin at either L93 (Syb2ΔTMR#1) or K91 (Syb2ΔTMR#2). B, Representative images of double immunofluorescence labeling for synapsin (red) and synaptobrevin-2 (green) in cortical neurons cultured from synaptobrevin-2 KO mice as described for Fig. 4. C–E, Summary graphs of the synapse density (B), the levels of the various synaptobrevin-2 proteins (expressed as the intensity ratio between overlapped synaptobrevin-2 and synapsin immunoreactivity; C), and the colocalization of synaptobrevin-2 and synapsin (expressed as the Pearson’s correlation coefficient; D) in images obtained as described for panel A. Data shown in summary graphs are means ± SEM; numbers of cells/independent cultures analyzed are listed in the bars. Statistical assessments were performed by Student’s t-test comparing a condition to the Syb KO + SybWT group (**, p<0.01; ***, p<0.001; n.d. = non-detectable).
Figure 5. Lipid-anchored synaptobrevin-2 fully rescues spontaneous synaptic vesicle fusion in synaptobrevin-2 KO neurons
A & B, Representative traces (left) and summary graphs of the frequency (middle) and amplitude (right) of mEPSCs (A) and mIPSCs (B) in cortical neurons cultured from synaptobrevin-2 KO mice and infected with control lentivirus (−), or lentiviruses expressing either wild-type (Syb2WT) or the two different versions of mutant lipid-anchored synaptobrevin-2 lacking the TMR (Syb2ΔTMR#1 and Syb2ΔTMR#2, respectively; see Fig. 4). Data shown are means ± SEMs; numbers of cells/independent cultures analyzed are listed in the bars. Statistical assessments were performed by Student’s t-test comparing a condition to the wild-type rescue group (*, p<0.05; **, p<0.01; ***, p<0.001).
Figure 6. Synaptobrevin-2 TMR is not essential for evoked synaptic vesicle fusion
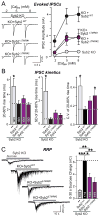
A, Representative traces (left) and summary graphs of the amplitude (right) of IPSCs evoked by isolated action potentials, monitored in cortical neurons cultured from synaptobrevin-2 KO mice and infected with control lentivirus (−), or lentiviruses expressing either wild-type (Syb2WT) or the two different versions of mutant lipid-anchored synaptobrevin-2 lacking the TMR (Syb2ΔTMR#1 and Syb2ΔTMR#2, respectively; see Fig. 4). Recordings were carried out in bath solutions containing 2, 5 and 8 mM extracellular Ca2+ [Ca]ex as indicated. B, Summary graphs of IPSC rise times (left), the variability of IPSC rise times (to assess the synchronicity of release; middle) expressed as the SD of rise times and the coefficient of variation of rise times (right) for IPSCs recorded in 5 mM [Ca2+]ex. C, Representative traces (left) and summary graphs of the total synaptic charge transfer (right) of IPSCs evoked by a 30 s application of 0.5 M hypertonic sucrose to induce exocytosis of the readily-releasable pool of vesicles (RRP), monitored in cortical neurons as described for panel A. Data shown in summary graphs are means ± SEMs; numbers of cells/independent cultures analyzed are listed in the bars. Statistical assessments were performed by Student’s t-test comparing a condition to the wild-type Syb2 rescue group (*, p<0.05; **, p<0.01; ***, p<0.001).
Figure 7. In syntaxin/synaptobrevin-double deficient neurons, spontaneous fusion is fully and evoked fusion partially rescued by lipid-anchored syntaxin-1A and synaptobrevin-2
A & B, Representative traces (left) and summary graphs of the frequency (middle) and rise times (right) of mEPSCs (A) or mIPSCs (B) in cortical neurons cultured from syntaxin-1A/synaptobrevin-2 double KO mice and infected with lentiviruses expressing only syntaxin-1 shRNAs (Control), or co-expressing syntaxin shRNAs together with shRNA-resistant wild-type syntaxin-1A and wild-type synaptobrevin-2 (Synt1AWT+Syb2WT), or shRNA-resistant lipid-anchored syntaxin-1A and synaptobrevin-2 (Synt1AΔTMR+ Syb2ΔTMR#1). C, Representative traces (left) and summary graphs of the charge transfer (right) of IPSCs evoked by isolated action potentials, monitored in cortical neurons as described for panels A and B. D, Representative traces (left) and summary graphs of the total synaptic charge transfer (right) of IPSCs evoked by 10 stimuli applied at 10 Hz, monitored in cortical neurons as described for panels A and B. E, Representative traces (left) and summary graphs of the total synaptic charge transfer (right) of IPSCs evoked by a 30 s application of 0.5 M hypertonic sucrose to induce exocytosis of the readily-releasable pool of vesicles (RRP), monitored in cortical neurons as described for panels A and B. Data shown are means ± SEM; numbers of cells/independent cultures analyzed are listed in the bars. Statistical assessments were performed by Student’s t-test comparing each of the three conditions to each other (*, p<0.05; **, p<0.01; ***, p<0.001).
Comment in
- Synaptic vesicle fusion without SNARE transmembrane regions.
Rizo J, Xu J. Rizo J, et al. Dev Cell. 2013 Oct 28;27(2):124-126. doi: 10.1016/j.devcel.2013.10.010. Dev Cell. 2013. PMID: 24176637
Similar articles
- Synaptic vesicle fusion without SNARE transmembrane regions.
Rizo J, Xu J. Rizo J, et al. Dev Cell. 2013 Oct 28;27(2):124-126. doi: 10.1016/j.devcel.2013.10.010. Dev Cell. 2013. PMID: 24176637 - Synaptotagmin-1-, Munc18-1-, and Munc13-1-dependent liposome fusion with a few neuronal SNAREs.
Stepien KP, Rizo J. Stepien KP, et al. Proc Natl Acad Sci U S A. 2021 Jan 26;118(4):e2019314118. doi: 10.1073/pnas.2019314118. Proc Natl Acad Sci U S A. 2021. PMID: 33468652 Free PMC article. - Munc13-1 MUN domain and Munc18-1 cooperatively chaperone SNARE assembly through a tetrameric complex.
Shu T, Jin H, Rothman JE, Zhang Y. Shu T, et al. Proc Natl Acad Sci U S A. 2020 Jan 14;117(2):1036-1041. doi: 10.1073/pnas.1914361117. Epub 2019 Dec 30. Proc Natl Acad Sci U S A. 2020. PMID: 31888993 Free PMC article. - The Synaptic Vesicle Release Machinery.
Rizo J, Xu J. Rizo J, et al. Annu Rev Biophys. 2015;44:339-67. doi: 10.1146/annurev-biophys-060414-034057. Annu Rev Biophys. 2015. PMID: 26098518 Review. - Mechanism of neurotransmitter release coming into focus.
Rizo J. Rizo J. Protein Sci. 2018 Aug;27(8):1364-1391. doi: 10.1002/pro.3445. Epub 2018 Jul 10. Protein Sci. 2018. PMID: 29893445 Free PMC article. Review.
Cited by
- A lever hypothesis for Synaptotagmin-1 action in neurotransmitter release.
Jaczynska K, Esser V, Xu J, Sari L, Lin MM, Rosenmund C, Rizo J. Jaczynska K, et al. bioRxiv [Preprint]. 2024 Jun 18:2024.06.17.599417. doi: 10.1101/2024.06.17.599417. bioRxiv. 2024. PMID: 38948826 Free PMC article. Updated. Preprint. - SNARE Modulators and SNARE Mimetic Peptides.
Khvotchev M, Soloviev M. Khvotchev M, et al. Biomolecules. 2022 Nov 29;12(12):1779. doi: 10.3390/biom12121779. Biomolecules. 2022. PMID: 36551207 Free PMC article. Review. - Molecular mechanism underlying SNARE-mediated membrane fusion enlightened by all-atom molecular dynamics simulations.
Rizo J, Sari L, Jaczynska K, Rosenmund C, Lin MM. Rizo J, et al. Proc Natl Acad Sci U S A. 2024 Apr 16;121(16):e2321447121. doi: 10.1073/pnas.2321447121. Epub 2024 Apr 9. Proc Natl Acad Sci U S A. 2024. PMID: 38593076 Free PMC article. - A Central Small Amino Acid in the VAMP2 Transmembrane Domain Regulates the Fusion Pore in Exocytosis.
Hastoy B, Scotti PA, Milochau A, Fezoua-Boubegtiten Z, Rodas J, Megret R, Desbat B, Laguerre M, Castano S, Perrais D, Rorsman P, Oda R, Lang J. Hastoy B, et al. Sci Rep. 2017 Jun 6;7(1):2835. doi: 10.1038/s41598-017-03013-3. Sci Rep. 2017. PMID: 28588281 Free PMC article. - Drug Delivery via Cell Membrane Fusion Using Lipopeptide Modified Liposomes.
Yang J, Bahreman A, Daudey G, Bussmann J, Olsthoorn RC, Kros A. Yang J, et al. ACS Cent Sci. 2016 Sep 28;2(9):621-630. doi: 10.1021/acscentsci.6b00172. Epub 2016 Aug 22. ACS Cent Sci. 2016. PMID: 27725960 Free PMC article.
References
- Archer DA, Graham ME, Burgoyne RD. Complexin regulates the closure of the fusion pore during regulated vesicle exocytosis. J Biol Chem. 2002;277:18249–18252. - PubMed
Publication types
MeSH terms
Substances
Grants and funding
- R01 MH089054/MH/NIMH NIH HHS/United States
- F32 NS067896/NS/NINDS NIH HHS/United States
- 1F32NS067896/NS/NINDS NIH HHS/United States
- HHMI/Howard Hughes Medical Institute/United States
- P50 MH086403/MH/NIMH NIH HHS/United States
- R01 NS077906/NS/NINDS NIH HHS/United States
- 1R01 MH089054/MH/NIMH NIH HHS/United States
LinkOut - more resources
Full Text Sources
Other Literature Sources
Molecular Biology Databases
Miscellaneous
