Effect of natural genetic variation on enhancer selection and function - PubMed (original) (raw)
. 2013 Nov 28;503(7477):487-92.
doi: 10.1038/nature12615. Epub 2013 Oct 13.
Affiliations
- PMID: 24121437
- PMCID: PMC3994126
- DOI: 10.1038/nature12615
Effect of natural genetic variation on enhancer selection and function
S Heinz et al. Nature. 2013.
Abstract
The mechanisms by which genetic variation affects transcription regulation and phenotypes at the nucleotide level are incompletely understood. Here we use natural genetic variation as an in vivo mutagenesis screen to assess the genome-wide effects of sequence variation on lineage-determining and signal-specific transcription factor binding, epigenomics and transcriptional outcomes in primary macrophages from different mouse strains. We find substantial genetic evidence to support the concept that lineage-determining transcription factors define epigenetic and transcriptomic states by selecting enhancer-like regions in the genome in a collaborative fashion and facilitating binding of signal-dependent factors. This hierarchical model of transcription factor function suggests that limited sets of genomic data for lineage-determining transcription factors and informative histone modifications can be used for the prioritization of disease-associated regulatory variants.
Figures
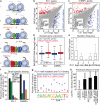
Figure 1. Genetic variation affects LDTF binding
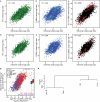
a, Model in which LDTFs (PU.1 and C/EBPα) establish regulatory function (explained in text) b, c, ChIP-Seq-defined binding intensity for PU.1 (b) and C/EBPα (c) in resting macrophages derived from C57BL/6J (x-axes) and BALB/cJ (y-axes). Dots represent normalized tag counts in 200 bp peaks. PU.1, C/EBPα and AP-1 motifs that were mutated in one genome (distinguished by symbol; C57BL/6J = red, BALB/cJ = blue) are highlighted for peaks with strain-specific binding (4-fold, FDR ≤ 1e-14). d, RNA-Seq-determined expression for genes nearest to strain-specific PU.1 or C/EBPα peaks. P-values are from one-tailed t-test. e, Variant frequency distributions for PU.1 binding ratio bins. Box midlines (d,e) are medians, boundaries are 1st/3rd quartiles, and whiskers extend to extremes. f, The percentage of polymorphic, strain-specific PU.1 and C/EBPα peaks with LDTF mutations. g, The observed position of SNPs generating strain-specific PU.1 motifs (n = 359) underlying differential (blue) or similar (red) PU.1 binding are shown. h. The proportion of NOD PU.1 motif mutations that abolished PU.1 binding for each group is shown (details in Extended Data Fig. 5).
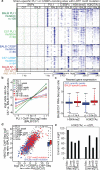
Figure 2. Genetic variation supports the LDTF collaborative binding model
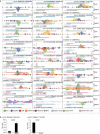
a, Normalized ChIP-Seq signal at 342 loci defined by strain-specific PU.1 and/or C/EBPα binding and containing LDTF motif mutations (rows) plotted for each factor/modification (columns). Left columns display SNPs as grey dots with mutated motifs highlighted by color (LDTF mutation labels at left). b, Log2 odds ratios for observing strain-specific motif mutations at strain-specific (>2-fold tag ratio, left and right bins) and similar (<2-fold tag ratio, middle bin) PU.1 peaks (details in Methods). **c,** Gene expression for genes nearest promoter-distal (>3 kb), strain-specific H3K4me2 and H3K27Ac peaks are shown (described in Fig. 1d). d, Normalized H3K27Ac log2 tag ratios (1 kb, y-axis) versus log2(PU.1xC/EBPα) tag strain ratios (200 bp, x-axis) for loci with PU.1 or C/EBPα binding. Strain-specific motif mutations are indicated by symbol and color. The distribution of H3K27Ac strain ratios stratified by strain mutations are shown (2-sided t-test). e, Enrichment significance (hypergeometric distribution testing, see Methods) of H3K27Ac-modification in eQTLs from different cell types are shown.
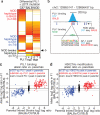
Figure 3. Validation of predicted binding and modification patterns
a, PU.1 binding at strain-specific loci are shown for C57BL/6J, BALB/cJ, and NOD/ShiLtJ mouse macrophages (columns; red = binding, white = no binding). All loci contain a strain-specific PU.1, C/EBP, or AP-1 motif. The NOD haplotype at these loci is indicated by the sidebar (red = BALB/cJ, blue = C57BL/6J, yellow = mixture). b, PU.1 binding, SNPs (lines), allele sharing, motif alignment and genome sequence are shown for a locus where NOD broke the C57/BALB haplotypes. c,d, Allele-specific ChIP-Seq ratios (y-axes) for PU.1 (c) and H3K27Ac (d) in CB6F1/J hybrid macrophages versus ChIP-Seq reads in parental strains (BALBc/C57 log2 ratios; x-axes) are shown for strain-specific peaks (blue = C57BL/6J, red = BALB/cJ-specific) and similarly-bound peaks (black) as defined by parental data.
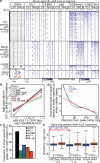
Figure 4. RelA/p65 binding is largely determined by LDTF binding
a, Strain-specific p65-bound regions were segregated into rows according to the bound strain (colored side bar). Binding/modification is shown with and without 100 ng/ml KLA treatment (−/+, 3rd header row). As in Fig. 2a, SNPs are indicated by grey dots and mutated motifs are highlighted by color (labeled beneath). b, The log2 odds ratio for observing strain-specific mutations are shown for bins of p65 binding as described in Fig. 2b. c, The percentage of polymorphic, differentially bound p65 loci harboring LDTF or NF-κB motif mutations is shown. d, The ratio of variant counts in strain-specific versus strain-similar peaks (y-axis) are shown relative to the peak centers for PU.1-, C/EBPα-, and p65-bound peaks in 10 bp bins (x-axis), smoothed using cubic spline. e, The relative amount of transcription (GRO-Seq) and mRNA production between strains after KLA treatment at the nearest gene to strain-specific p65 loci is shown. P-values are from one-tailed t-test.
Figure 5. Validation of strain-specific enhancer activity and causal variants
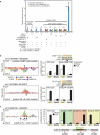
a, Enhancer reporter schematic. One kb enhancer-like fragments were cloned downstream of an HSV-TK-luciferase reporter gene and tested for basal and KLA-inducible transcriptional activity in RAW264.7 macrophages. b, Genomic features (left) and regulatory activities (right) of the strain-similar PU.1 -14 kb enhancer positive control from C57BL/6J and BALB/cJ-derived macrophages. (Extended Data Fig. 9-10 show all 33 loci tested). In the left panel the horizontal midline represents the 1 kb stretch of cloned DNA and SNPs are indicated with vertical black lines. ChIP-Seq tag pile-ups are shown for PU.1 (green), C/EBPα (blue), p65 (red), H3K27Ac (purple), and H3K4me2 (orange) for C57BL/6J (above midline) and BALB/cJ (below midline) with identical scales after KLA treatment (100 ng/ml, 1 h). c, Representative example of a strain-specific locus and the effect of a single base pair swap at the indicated PU.1 motif SNP on enhancer activity. See Extended Data Fig. 10b,c for additional examples and allele-swapping controls. Bargraphs plot mean ± s.d.
Extended Data Figure 1. ChIP-Seq data characteristics
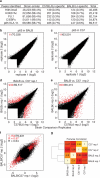
a, Summary of ChIP-Seq features identified. The number of ChIP-seq regions/peaks identified in untreated primary thioglycolate-elicited macrophages are tabulated for H3K4me2, H3K27Ac, PU.1 and C/EBPα. Peaks for p65 were quantified in macrophages treated with 100 ng/ml KLA for 1 hr. Unless otherwise noted, modification and binding were considered strain-specific at ≥4-fold difference between strains in sequenced tags and the FDR was <1e-14 based on Poisson cumulative distribution testing and Benjamini & Hochberg correction. b-e, Reproducibility and strain-specific binding. Two separate pools of thioglycolate-elicited macrophages from mice from each strain (C57BL/6J, BALB/cJ) were treated with KLA for 1 hour. ChIP-seq for p65 was performed separately on each pool (see Methods). The number of normalized sequencing tags at the union of peaks identified in the indicated experiments is shown. Peaks highlighted in red were deemed experiment-specific using criteria applied throughout this study (4-fold, and FDR<1e-14 from the cumulative Poisson distribution and Benjamini and Hochberg FDR estimation). The number of experiment-specific peaks is indicated (red) relative to the total number of peaks (black). f, Comparison of the p65 log2 peak tag ratio between strains and experimental sets for all peaks (black), highlighting experiment-specific peaks (red) identified in either (d) or (e). g, Heat map showing pairwise correlation between all p65 experiments. Pearson correlation coefficients are given for each comparison.
Extended Data Figure 2. Strain-specific LDTF binding correlates with variant density and location in LDTF motifs but not with genomic context
a, Genomic features do not distinguish between strain-similar and strain-specific LDTF binding. Peaks were restricted to promoter-distal peaks (> 3 kb to gene start sites). Genomic features (distance to nearest gene, distance to nearest repeat, CpG content, conservation score) were compared among three pairs of strain-similarly bound and strain-specifically bound PU.1 and/or C/EBPα loci (listed as Group 1 – Group 6). Box midlines are medians and boundaries are 1st and 3rd quartiles. Whiskers extend to the extreme data points. CpG content and conservation were quantified in 1 kb regions centered on the LDTF peak. P-values from 2-sided t-test are given if below 0.05. b, Strain-specific C/EBPα binding occurs in regions with increased variant density. ChIP-Seq tag counts in 200 bp peak regions were stratified into 5 bins according to log2 ratios of peak tag counts in BALB/cJ versus C57BL/6J (x-axis, log2 ratio) and the variant density distributions are shown per bin. c,d, Variant density distribution in strain-specific peaks. Mean variant densities within 10 bp bins relative to ChIP-Seq peak centers in strain-similar (red) or strain-specific peaks (blue). e, Strain-specific PU.1 binding correlates with mutations in their respective motifs. PU.1 motif mutations were quantified in PU.1-bound regions and plotted against the logarithmic ratio of PU.1 peak tag counts in each strain (binding ratio) (x-axis). The frequency of motifs that were mutated in BALB/cJ are plotted in red and those mutated in C57BL/6J in blue. f, The analogous relationship as shown in e for PU.1 is plotted for C/EBP motif mutations versus C/EBPα strain binding ratio.
Extended Data Figure 3. Strain-specific PU.1 and C/EBPα binding correlates with strain-specific LDTF motifs
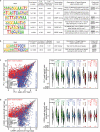
a, Top and degenerate motifs enriched in H3K4me2 and PU.1 or C/EBPα ChIP-Seq peaks. b, NF-κB consensus and degenerate motifs enriched in p65 ChIP-Seq peaks. These motifs were used to query individual genome sequences and identify strain-specific motifs in subsequent analysis. Degenerate/’weak’ motif occurrence numbers for a given factor include ChIP-Seq peaks containing ‘strong’ motifs. Position weight matrices and log-odds score thresholds for each motif are given in Supplementary Table 1. c, Mutations in LDTF motifs affect PU.1 and d, C/EBPα binding. The left panels show scatterplots for the ChIP-Seq-defined binding of PU.1 (c) and C/EBPα (d) between C57BL/6J (x-axes) and BALB/c (y-axes). Strain-specific motifs were queried within 100 bp of each peak position. Red symbols designate binding events at loci where a polymorphism mutated a C/EBP, PU.1, or AP-1 motif in the C57BL/6J genome, whereas the motif was intact in the BALB/cJ genome. Blue points highlight mutations in these motifs in the BALB/cJ genome only. Violin plots in the right panels show the effect of each motif mutation (along x-axes: PU.1, C/EBP, AP-1 and NF-κB) on the ratio of PU.1 (c) and C/EBPα (d) binding between mouse strains, (y-axes: positive values = BALB/cJ-specific, negative values = C57BL/6J-specific). Tag ratio distributions for peaks overlapping C57BL/6J motif mutations are on the left (light colors), those for peaks overlapping BALB/cJ motif mutations are on the right (dark colors). The fold-difference between mean binding ratios is indicated under the pair of distributions for each motif. The grey distribution indicates PU.1- or C/EBPα- bound loci not overlapping strain-specific motifs.
Extended Data Figure 4. Effects of cognate motif distance from peak center, variant position within a motif and the presence of alternative motifs on strain-differential binding of PU.1 and C/EBPα
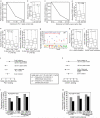
a-d, PU.1 and C/EBP motif mutations near the experimentally derived peak center are associated with impaired binding. a,c, The ratios of the frequencies of variant-containing motifs at the given distances from strain-differentially vs. strain-similarly bound peak centers (>2-fold vs. <2-fold tag count ratio) for 570 PU.1 (a) and 278 C/EBP (b) variant-containing motifs are shown, respectively. b,d, The distribution of absolute strain peak tag count ratios of peaks whose center is at the given distances from mutated PU.1 (b) or C/EBP (d) motifs. Box midlines are medians and boundaries are 1st and 3rd quartiles. Whiskers extend to the extreme data points. P-values are from 2-sided t-test. e,f, Effects of alternative PU.1 and C/EBP motifs and core mutations on binding. The number of non-mutated, “alternate”, PU.1 or C/EBP motifs in the strain with a PU.1 or C/EBP motif mutation were counted and the absolute respective PU.1 or C/EBPα log2 strain binding ratio is shown. g, Defining the C/EBP motif core by comparing differential vs. similar C/EBPα binding. Sequence variants within C/EBP motifs located in loci devoid of alternate C/EBP motifs (n = 178) were counted according to whether they were in differential (blue) or similar (red) C/EBPα-bound peaks. h, The distribution of PU.1 binding strain log2 ratios (x-axis) is shown for PU.1 mutations located in the PU.1 core and non-core nucleotides (defined in Fig. 1g). i, The C/EBPα binding strain log2 ratio is shown for C/EBP core and non-core mutations as defined in g. j,k, Motif mutations predominately occur at differentially bound loci. The odds ratios (x-axis; equation shown in box) describing the relative effect of the indicated characteristics of mutated motifs on differential binding relative to similar binding are shown for PU.1 (j) and C/EBPα (k). Whiskers show 95% confidence intervals. l,m, The percentage of respective motif mutations consistent with altered PU.1 (l) and C/EBPα (m) binding are shown for the indicated categories of motif mutations.
Extended Data Figure 5. Analysis pipeline for predicting functional PU.1 mutations in NOD
Data is shown in Fig. 1h.
Extended Data Figure 6. LDTF motif mutations are enriched at strain-specific C/EBPα-bound loci relative to strain-similar loci
a, The log2 odds ratio for observing a C57BL/6J- versus BALB/cJ-specific mutation in the indicated for three bins of C/EBPα binding ratios: similar (middle bin), or strain-specifically C/EBPα bound (left and right bins). Details in the Methods section. b, Collaborative binding is largely not mediated by direct protein-protein interactions. 14,199 loci bound by PU.1 and C/EBPα were centered on the PU.1 weak motif (0 on x-axes) and cumulative instances of C/EBP and AP-1 motifs were plotted at each position relative to the central PU.1 motif. Interferon response factor (IRF) half-sites are plotted as control for a factor that requires direct protein-protein interactions with PU.1 for DNA binding. The motifs in each comparison showing overlapping sequence and base pair distances are indicated to the right. Peak distances from the central PU.1 motif are indicated in the histograms. ‘rc’ in b stands for reverse complement. c, Allelle-specific C/EBPα binding in F1 heterozygotes is similar to binding in homozygous parental strains. C/EBPα ChIP-seq reads from CB6F1/J Hybrid F1 macrophages were mapped with no mismatches to both parental genome sequences to identify allele-specific reads. C/EBPα log2 peak tag ratios between the parental strains (BALB/cJ vs. C57BL/6J) are shown on the x-axis and the log2 ratio of allele-specific reads in the F1 Hybrids are shown on the y-axis (BALB/cJ allele vs. C57BL/6J allele). C57BL/6J-specific C/EBPα regions are blue, BALB/cJ-specific C/EBPα regions are red, and strain-similar C/EBPα regions are black. Strain-specific or similar regions were defined from parental data.
Extended Data Figure 7. Strain-specific epigenetic marks correlate with LDTF binding, and LDTF mutations segregate with altered H3K4me2 deposition
a-f, Strain-specificity of LDTF binding and epigenetic marks. The relative amount of H3K4me2 (a-c) and H3K27Ac (d-f) between C57BL/6J and BALB/cJ (x-axes) is highly correlated with the amount of PU.1, C/EBPα, or the product (PU.1*C/EBPα) bound. The log2 ratios of the peak tag counts for PU.1, C/EBPα and PU.1*C/EBPα in each strain is shown relative to the log2 of the peak tag count ratios for H3K4me2 or H3K27Ac, respectively. Loci containing strain-specific LDTF motifs in a differentially PU.1 or C/EBPα bound peak are highlighted. Correlation coefficients (Pearson) are indicated for each comparison. g, LDTF mutations segregate with altered H3K4me2 deposition. The log2 of the ratio of the product of the normalized peak tag counts for PU.1 and C/EBPα in 200 bp in each strain (x-axis) is compared to the log2 H3K4me2 peak tag ratio in 1 kb (y-axis) for loci containing at least a PU.1 or C/EBPα peak. Strain-specific LDTF motif mutations are indicated by the designated symbols and colored by the mutated strain (C57BL/6J red, BALB/cJ blue). The distribution of H3K4me2 strain ratios stratified by corresponding LDTF strain mutations are shown to the right with p-value from a 2-sided t-test. h, Relationships between H3K27Ac patterns in different cell types. Hierarchical clustering of H3K27Ac-positive regions as determined by ChIP-Seq and analysis with HOMER. The number of ChIP-seq tags in each of the 86,264 H3K27Ac-marked regions used for comparison with eQTL data in Fig. 2e that were detected in at least one cell type were clustered using Euclidean distance.
Extended Data Figure 8. LDTFs prime the p65 cistrome
a, The 69,517 regions that gained p65 in C57BL/6J upon KLA treatment were analyzed for binding of PU.1 and C/EBPα without and with KLA treatment as shown in the pie charts. Loci not bound by PU.1 or C/EBPα after KLA treatment were analyzed by de novo motif finding. The most enriched motif was AP-1 and the second-most enriched motif was NF-κB. b, Violin plots of the p65 strain ratios of mean-normalized p65 binding for p65-bound peaks stratified by motifs mutations present in either BALB/cJ or C57BL/6J. Mutated motifs included PU.1 (strong and weak), C/EBP (strong and weak), C/EBP:AP-1, AP-1, and NF-κB. The effect on p65 binding per group is shown by comparing the mean-normalized p65 tag binding ratio along the y-axis (log2(BALB/cJ / C57BL/6J), positive values = BALB/cJ-specific, negative values = C57BL/6J-specific). White circles indicate the distribution means, and the average fold change associated with C57BL/6J-mutating and BALB/cJ-mutating SNPs in the respective motifs is given beneath. One-sided t-test p-values between each pair of distributions ranged from 1e-29 to 1e-14. c, Variant density in strain-specific and strain-similar p65 peaks. Mean variant density within 10 bp bins relative to p65 ChIP-Seq peak centers in strain-similar (red) or strain-specific peaks (blue). d-e, The variant density distribution in strain-specific p65 peaks is broader than those for PU.1 or C/EBPα. Fold enrichment of variant densities in strain-specific relative to strain-similar peaks (y-axes) for PU.1 (d), C/EBPα (e) and p65 (f) are shown relative to the peak centers (x-axes). Ratios plotted in d and e are from data in Extended Data Fig. 2c,d, respectively.
Extended Data Figure 9. Validation of strain-specific enhancer activity
a, Enhancer activity in transient reporter assays correlates with strain-specific LDTF and p65 binding. Luciferase assay results for 24 loci (20 strain-specific enhancers with strain-specific motifs, 1 positive control with strain-similar enhancer activity (row 7, column 3), 2 negative controls lacking enhancer activity in both strains (row 8, columns 1 and 2), and 1 strain-specific enhancer lacking a strain-specific motif (row 8, column 3) in transiently transfected RAW 264.7 cells 48 hours after transfection. Each 1 kb locus is represented by the horizontal midline within a box (see Fig. 5). ChIP-seq tag pileups are shown for PU.1 (green), C/EBPα (blue), p65 (red), H3K27Ac (purple), and H3K4me2 (orange) for C57BL/6J (above midline) and BALB/cJ (below midline) with identical scales. Binding/modification data are shown after treatment with 100 ng/ml KLA. Vertical black lines indicate SNP locations. Horizontal bars indicate average luciferase (enhancer) activity of the empty vector (blue, no enhancer), activity of a locus cloned from either strain in grey C57BL/6J (above) and BALB/cJ (below) under basal conditions, or after overnight stimulation with 100 ng/ml KLA (pink). Luciferase values from transiently transfected cells were normalized to the activity measured for a co-transfected UB6 promoter-β-Gal reporter construct. Empty vector values were scaled to 0.5 for the first four loci and to 1 for the remaining loci. Error bars show standard deviations calculated from 3 biological replicates, average values are indicated next to each bar. Experiments were replicated at least 3 times. Significant strain-specific enhancer activity is indicated by § (grey without treatment, red after KLA treatment, one-tailed t-test, p-value < 0.05). b, Chromatinization is necessary for the strain specificity of a subset of enhancers. RAW264.7 cells were stably transfected with the two constructs harboring the loci that showed strain-specific binding but lacked strain-specific enhancer activity in transient reporter assays (row 4, column 1 and row 1, column 3, marked by *). Luciferase activity measured in lysates of stably transfected cells was normalized to total protein content.
Extended Data Figure 10. Motif analysis identifies causal SNPs in enhancers
Regions of ~1 kb size centered on PU.1 or C/EBPα ChIP-Seq peaks of similar tag count in C57BL/6J and BALB/cJ (< 2-fold difference) that contain a variant in a motif for the respective factor within 100 bp of the peak center were cloned into a luciferase reporter plasmid containing a minimal HSV-TK derived promoter. Three independent transient transfection experiments were performed in RAW264.7 cells, with triplicate transfections of each construct. Where indicated, variant nucleotides in a motif were mutated to that present in the other strain, and the resulting enhancer activity was scored relative to the wild-type allele. Shown are the ratios of the normalized luciferase activity of the C57BL/6J vs BALB/cJ alleles from a representative experiment. Luciferase values from transiently transfected cells were normalized to the activity measured for a cotransfected UB6 promoter β-Gal reporter construct, error bars represent derived standard deviations calculated by Gaussian error propagation. Constructs exhibiting significantly different activity ratios in two out of three experiments as determined by two-sided t-test (p < 0.05) are marked with a star. Strain and motif mutated by a variant are indicated below. In the table below, plus signs indicate whether a tested enhancer contains an alternative motif for the same factor, a variant at a motif position that is not located at a motif core as defined in Fig. 1g and Extended Data Fig. 4g, or a variant in a motif located less than 20 bp away from the peak center. Characteristics of the loci and primer sequences are in Supplementary Table 3. b, Identifying causal variants by motif analysis. Left panels show the ChIP-Seq pileups and SNP locations as in Extended Data Fig 9. Right panels plot the relative enhancer reporter luciferase activities of the loci shown on the left, either in the wild type configuration or when swapping the SNP indicated by a black triangle by site-directed mutagenesis. Motifs mutated by the indicated SNPs are shown above, with the mutation underlined and in red. c, To confirm that the centrally located PU.1 motif is essential for the C57BL/6J- specific activity, a 1 kb fragment of the locus from C57BL/6J or BALB/cJ was cloned into the luciferase reporter described in Fig. 5 and the effects of swapping alleles at the predicted causal PU.1 SNP and flanking control 5’ and 3’ SNPs on enhancer activity are shown. Swapping alleles at the PU.1 SNP reversed strain-specific enhancer activity whereas swapping alleles at either flanking SNP had no significant effect.
Comment in
- Gene regulation: from genetic variation to phenotype via chromatin.
Stower H. Stower H. Nat Rev Genet. 2013 Dec;14(12):824. doi: 10.1038/nrg3622. Epub 2013 Oct 29. Nat Rev Genet. 2013. PMID: 24166029 No abstract available.
Similar articles
- Analysis of Genetically Diverse Macrophages Reveals Local and Domain-wide Mechanisms that Control Transcription Factor Binding and Function.
Link VM, Duttke SH, Chun HB, Holtman IR, Westin E, Hoeksema MA, Abe Y, Skola D, Romanoski CE, Tao J, Fonseca GJ, Troutman TD, Spann NJ, Strid T, Sakai M, Yu M, Hu R, Fang R, Metzler D, Ren B, Glass CK. Link VM, et al. Cell. 2018 Jun 14;173(7):1796-1809.e17. doi: 10.1016/j.cell.2018.04.018. Epub 2018 May 17. Cell. 2018. PMID: 29779944 Free PMC article. - Remodeling of the enhancer landscape during macrophage activation is coupled to enhancer transcription.
Kaikkonen MU, Spann NJ, Heinz S, Romanoski CE, Allison KA, Stender JD, Chun HB, Tough DF, Prinjha RK, Benner C, Glass CK. Kaikkonen MU, et al. Mol Cell. 2013 Aug 8;51(3):310-25. doi: 10.1016/j.molcel.2013.07.010. Mol Cell. 2013. PMID: 23932714 Free PMC article. - Gene regulation: from genetic variation to phenotype via chromatin.
Stower H. Stower H. Nat Rev Genet. 2013 Dec;14(12):824. doi: 10.1038/nrg3622. Epub 2013 Oct 29. Nat Rev Genet. 2013. PMID: 24166029 No abstract available. - Exploiting genomics and natural genetic variation to decode macrophage enhancers.
Romanoski CE, Link VM, Heinz S, Glass CK. Romanoski CE, et al. Trends Immunol. 2015 Sep;36(9):507-18. doi: 10.1016/j.it.2015.07.006. Epub 2015 Aug 19. Trends Immunol. 2015. PMID: 26298065 Free PMC article. Review. - Genetic and genomic approaches to understanding macrophage identity and function.
Glass CK. Glass CK. Arterioscler Thromb Vasc Biol. 2015 Apr;35(4):755-62. doi: 10.1161/ATVBAHA.114.304051. Epub 2015 Mar 5. Arterioscler Thromb Vasc Biol. 2015. PMID: 25745059 Free PMC article. Review.
Cited by
- Genetic Variations in the NRF2 Microsatellite Contribute to the Regulation of Bovine Sperm-Borne Antioxidant Capacity.
Anwar K, Thaller G, Saeed-Zidane M. Anwar K, et al. Cells. 2024 Sep 24;13(19):1601. doi: 10.3390/cells13191601. Cells. 2024. PMID: 39404365 Free PMC article. - An integrated transcription factor framework for Treg identity and diversity.
Chowdhary K, Léon J, Mathis D, Benoist C. Chowdhary K, et al. Proc Natl Acad Sci U S A. 2024 Sep 3;121(36):e2411301121. doi: 10.1073/pnas.2411301121. Epub 2024 Aug 28. Proc Natl Acad Sci U S A. 2024. PMID: 39196621 - FANS Unfixed: Isolation and Proteomic Analysis of Mouse Cell Type-Specific Brain Nuclei.
Bedwell L, Mavrotas M, Demchenko N, Yaa RM, Willis B, Demianova Z, Syed N, Whitwell HJ, Nott A. Bedwell L, et al. J Proteome Res. 2024 Sep 6;23(9):3847-3857. doi: 10.1021/acs.jproteome.4c00161. Epub 2024 Jul 26. J Proteome Res. 2024. PMID: 39056441 Free PMC article. - Position-dependent function of human sequence-specific transcription factors.
Duttke SH, Guzman C, Chang M, Delos Santos NP, McDonald BR, Xie J, Carlin AF, Heinz S, Benner C. Duttke SH, et al. Nature. 2024 Jul;631(8022):891-898. doi: 10.1038/s41586-024-07662-z. Epub 2024 Jul 17. Nature. 2024. PMID: 39020164 Free PMC article. - Pioneer factors: nature or nurture?
Stoeber S, Godin H, Xu C, Bai L. Stoeber S, et al. Crit Rev Biochem Mol Biol. 2024 Jun-Aug;59(3-4):139-153. doi: 10.1080/10409238.2024.2355885. Epub 2024 May 22. Crit Rev Biochem Mol Biol. 2024. PMID: 38778580 Free PMC article. Review.
References
Publication types
MeSH terms
Substances
Grants and funding
- T32 AR059033/AR/NIAMS NIH HHS/United States
- CA17390/CA/NCI NIH HHS/United States
- R01 DK091183/DK/NIDDK NIH HHS/United States
- P30 DK063491/DK/NIDDK NIH HHS/United States
- P30 CA023100/CA/NCI NIH HHS/United States
- 5T32DK007494/DK/NIDDK NIH HHS/United States
- DK063491/DK/NIDDK NIH HHS/United States
- P01 DK074868/DK/NIDDK NIH HHS/United States
- R01 CA173903/CA/NCI NIH HHS/United States
- DK091183/DK/NIDDK NIH HHS/United States
- T32 DK007494/DK/NIDDK NIH HHS/United States
LinkOut - more resources
Full Text Sources
Other Literature Sources
Molecular Biology Databases
