Whole-genome screening identifies proteins localized to distinct nuclear bodies - PubMed (original) (raw)
Whole-genome screening identifies proteins localized to distinct nuclear bodies
Ka-Wing Fong et al. J Cell Biol. 2013.
Abstract
The nucleus is a unique organelle that contains essential genetic materials in chromosome territories. The interchromatin space is composed of nuclear subcompartments, which are defined by several distinctive nuclear bodies believed to be factories of DNA or RNA processing and sites of transcriptional and/or posttranscriptional regulation. In this paper, we performed a genome-wide microscopy-based screening for proteins that form nuclear foci and characterized their localizations using markers of known nuclear bodies. In total, we identified 325 proteins localized to distinct nuclear bodies, including nucleoli (148), promyelocytic leukemia nuclear bodies (38), nuclear speckles (27), paraspeckles (24), Cajal bodies (17), Sam68 nuclear bodies (5), Polycomb bodies (2), and uncharacterized nuclear bodies (64). Functional validation revealed several proteins potentially involved in the assembly of Cajal bodies and paraspeckles. Together, these data establish the first atlas of human proteins in different nuclear bodies and provide key information for research on nuclear bodies.
Figures
Figure 1.
Identification and characterization of proteins in various nuclear subcompartments. (A) Overall schematic flow of this protein localization screen. (B) Representative images of proteins that show colocalization with various nuclear body markers. Bar, 10 µm. (C) The pie chart shows the distribution of proteins in various nuclear subcompartments (148 nucleolar proteins were not included). A total of 325 proteins that formed nuclear foci were identified in this screen, including 148 in the nucleolus, 38 in PML bodies, 27 in nuclear speckles, 24 in paraspeckles, 17 in Cajal bodies, 5 in Sam68 nuclear bodies, 2 in Polycomb bodies, and 64 proteins in uncharacterized nuclear subcompartments (please also see
Table S1
).
Figure 2.
Comparison of our study with datasets on nuclear subcompartments. Datasets were created for each nuclear subcompartment based on online databases or recent review articles. NOPdb (Ahmad et al., 2009) was used to represent nucleolar proteins. A proteomic analysis of interchromatin granule clusters (Saitoh et al., 2004) was used to represent the nuclear speckles dataset. A PML body interactome analysis (Van Damme et al., 2010) was used to represent proteins in PML bodies. A list of Cajal body proteins from a recent review paper (Machyna et al., 2013) was used to represent proteins in Cajal bodies. A list of paraspeckle proteins from a review (Bond and Fox, 2009) was used to represent proteins in paraspeckles. Venn graphs were used to show the extent of overlapping between an available dataset (green) and our study (blue). A group of proteins that are uniquely identified in our study and have been reported by others in the literature were presented in dark blue. The other groups of proteins that are confirmed by our shRNA screen to be involved in the assembly of Cajal bodies or paraspeckles were presented in yellow. Please also see
Table S2
and
Table S3
.
Figure 3.
Interactome analysis of nuclear foci proteome. (A–E) A random selected protein from each nuclear subcompartment was used as the bait for tandem affinity purification and mass spectrometry analysis. The protein–protein interaction networks characterized for Fam76B (nuclear speckles; A), ZBTB45 (PML bodies; B), PHC2 (Polycomb bodies; C), KHDRBS3 (Sam68 nuclear bodies; D), or ZNF24 (paraspeckles; E) are presented in the cartoon (please also see
Table S7
).
Figure 4.
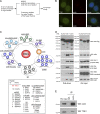
Identification of TOE1 function in regulating Cajal body homeostasis. (A) Schematic workflow showing how the function of proteins localized to Cajal bodies was studied (please also see
Fig. S3, C and D
). (B) TOE1 is an integral component of Cajal bodies. The localization of TOE1 in HeLa cells was determined by coimmunostaining using anti-TOE1 and anti-coilin (top) or anti-SMN (bottom). Bars, 10 µm. (C) Proteomic analysis of TOE1-containing protein complexes. A cartoon (top part) or a list (bottom part) was presented. (D) SFB-tagged NUAK2 (negative control), TOE1, and TCAB1 were ectopically expressed in HEK293T cells. Pull-down experiments were conducted using streptavidin beads, and immunoblotting was performed with anti-Flag and the indicated antibodies. The asterisk indicates a nonspecific band. (E) Association of endogenous TOE1 and coilin was confirmed by co-IP experiments. Immunoprecipitation (IP) was conducted using the anti-coilin antibody or normal rabbit IgG. WB, Western blot.
Figure 5.
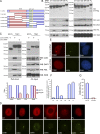
TOE1 is recruited to Cajal bodies in a coilin-dependent manner. (A) Schematic representation of TOE1 mutants used in this study. ZnF, zinc finger domain; DEDD, deadenylation; FL, full length. (B) Mapping coilin-binding domain in TOE1. 293T cells were transfected with constructs encoding full-length or mutant TOE1. Pull-down experiments were performed using streptavidin beads and blotted with anti-Flag (for TOE1 mutants), anti-coilin, anti-DKC1, anti-FBL, or anti-SMN antibodies (please also see
Fig. S4 A
). (C) Coilin binding is a prerequisite for the loading of DKC1 and FBL, but not SMN, into TOE1-containing complexes. Constructs encoding TOE1 or a negative control NFYA were transfected into HeLa cells stably expressing control shRNA or coilin shRNA. Pull-down experiments were performed using streptavidin beads and blotted with anti-Flag (for negative control NYFA and TOE1), anticoilin, anti-DKC1, anti-FBL, or anti-SMN antibodies. Quantitative results showed the ratio (±SD) of the indicated proteins pulled down by TOE1 in coilin knockdown cells relative to those in control cells (n = 3 independent experiments). The asterisk indicates a nonspecific band. (D) TOE1 localizes to Cajal bodies in a coilin-dependent manner. Indicated mutants of TOE1 were transiently expressed in HeLa cells and then subjected to immunostaining using anti-Flag and anti-coilin antibodies. (E) Cajal body localization of TOE1 was abolished in coilin-depleted cells. Localization of TOE1 was detected in HeLa cells stably expressing control shRNA (top) or coilin shRNA (bottom) by immunostaining using anti-TOE1 and anti-coilin antibodies. (F) Quantitative results showed the percentage of cells (±SD) in which indicated proteins colocalized with coilin (n = 3 independent experiments). (G) Quantitative results showed the percentage of cells (±SD) expressing control or coilin shRNA in which TOE1 colocalized with coilin (n = 3 independent experiments). sh_CTL_, control shRNA; WB, Western blot. Bars, 10 µm.
Figure 6.
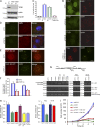
TOE1 is required for maintaining Cajal body integrity and efficient splicing. (A) TOE1 was down regulated in HeLa cells transfected by siRNA against TOE1. (B) Knockdown of TOE1 affected the number and homogeneity of coilin foci. A control and two different siRNAs against TOE1 were used to knock down endogenous TOE1 expression in HeLa cells. Localization of TOE1 and coilin was detected by immunostaining using anti-TOE1 and anti-coilin. To recover the expression of TOE1, a construct encoding an siRNA-resistant form of TOE1 was cotransfected with si_TOE1_-A. The exogenous protein was detected by the anti-Flag antibody. (C) The bar graph shows the percentage of cells (±SD) containing more than four coilin foci after the indicated treatment. WT, wild type. (D and E) Down-regulation of TOE1 disrupted localization of SMN complex and newly synthesized Sm-D1. Control siRNA (si_CTL_)– or si_TOE1_-A–treated cells were subjected to coimmunostaining using anti-coilin and anti-SMN antibodies (D) or anti-coilin and anti-Flag (for HA-Flag–tagged Sm-D1) antibodies (E). (F) Quantitative results showed the percentage of cells (±SD) in which the indicated proteins colocalized with coilin (n = 3 independent experiments). (G) TOE1 is required for efficient splicing. A splicing reporter was introduced into HeLa cells or WI-38 cells with the indicated treatment. 24 h later, both spliced and unspliced RNAs were amplified from cDNA using the indicated primer sets. (H) The intensity of unspliced and spliced products was quantified by Quantity One software. The ratios of spliced to unspliced RNAs (±SD) were normalized by controls and presented as a bar graph for the indicated groups (n = 3 independent experiments). (I) TOE1 down-regulation suppresses cell growth. Cells were harvested and counted at day 1–5 after siRNA transfection. The cell numbers (±SD) were plotted against the days after siRNA treatment (n = 3 independent experiments). Bars, 10 µm.
Figure 7.
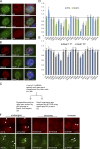
Identify proteins required for paraspeckle formation using shRNA screen. (A and B) Representative images showed colocalization of newly identified paraspeckle proteins with paraspeckles marker p54nrb (A) or NEAT1 long noncoding RNA (B). (C–E) Phenotypic screen for proteins affecting paraspeckles assembly. (C) A schematic flow for shRNA screen is presented. (D) Bar graph showed the percentage (±SD) of paraspeckles-containing cells determined by p54nrb or NEAT1 staining after the indicated shRNA treatment relative to control mock shRNA-treated cells (n = 3 independent experiments). (E) Bar graph showed relative NEAT1 expression (±SD) to control mock shRNA-treated cells and normalized to GAPDH (n = 3 independent experiments). Dotted lines display the level of control mock shRNA-treated cells for comparison. (F) Representative images showed phenotypes after shRNA transduction. The localization of paraspeckles foci was detected with the use of anti-p54nrb antibodies (top) or FITC-RNA probes against NEAT1 (bottom). Arrows show the paraspeckles foci labeled by anti-p54nrb antibodies (top) or RNA probes against NEAT1 (bottom). CTL, control. Bars, 10 µm.
Similar articles
- Biogenesis and function of nuclear bodies.
Mao YS, Zhang B, Spector DL. Mao YS, et al. Trends Genet. 2011 Aug;27(8):295-306. doi: 10.1016/j.tig.2011.05.006. Epub 2011 Jun 15. Trends Genet. 2011. PMID: 21680045 Free PMC article. Review. - The proteins of intra-nuclear bodies: a data-driven analysis of sequence, interaction and expression.
Mohamad N, Bodén M. Mohamad N, et al. BMC Syst Biol. 2010 Apr 13;4:44. doi: 10.1186/1752-0509-4-44. BMC Syst Biol. 2010. PMID: 20388198 Free PMC article. - Paraspeckles: a novel nuclear domain.
Fox AH, Lam YW, Leung AK, Lyon CE, Andersen J, Mann M, Lamond AI. Fox AH, et al. Curr Biol. 2002 Jan 8;12(1):13-25. doi: 10.1016/s0960-9822(01)00632-7. Curr Biol. 2002. PMID: 11790299 - Nuclear bodies: new insights into assembly/dynamics and disease relevance.
Sleeman JE, Trinkle-Mulcahy L. Sleeman JE, et al. Curr Opin Cell Biol. 2014 Jun;28:76-83. doi: 10.1016/j.ceb.2014.03.004. Epub 2014 Apr 3. Curr Opin Cell Biol. 2014. PMID: 24704702 Review.
Cited by
- The Identification of Nuclear FMRP Isoform Iso6 Partners.
Ledoux N, Lelong EIJ, Simard A, Hussein S, Adjibade P, Lambert JP, Mazroui R. Ledoux N, et al. Cells. 2023 Dec 9;12(24):2807. doi: 10.3390/cells12242807. Cells. 2023. PMID: 38132127 Free PMC article. - TOE1 is an inhibitor of HIV-1 replication with cell-penetrating capability.
Sperandio S, Barat C, Cabrita MA, Gargaun A, Berezovski MV, Tremblay MJ, de Belle I. Sperandio S, et al. Proc Natl Acad Sci U S A. 2015 Jun 30;112(26):E3392-401. doi: 10.1073/pnas.1500857112. Epub 2015 Jun 8. Proc Natl Acad Sci U S A. 2015. PMID: 26056259 Free PMC article. - Specific interaction with the nuclear transporter importin α2 can modulate paraspeckle protein 1 delivery to nuclear paraspeckles.
Major AT, Hogarth CA, Miyamoto Y, Sarraj MA, Smith CL, Koopman P, Kurihara Y, Jans DA, Loveland KL. Major AT, et al. Mol Biol Cell. 2015 Apr 15;26(8):1543-58. doi: 10.1091/mbc.E14-01-0678. Epub 2015 Feb 18. Mol Biol Cell. 2015. PMID: 25694451 Free PMC article. - Deep Imaging: the next frontier in microscopy.
Roukos V, Misteli T. Roukos V, et al. Histochem Cell Biol. 2014 Aug;142(2):125-31. doi: 10.1007/s00418-014-1239-5. Epub 2014 Jul 3. Histochem Cell Biol. 2014. PMID: 24989801 Free PMC article. Review. - Nuclear LC3 Associates with Slowly Diffusing Complexes that Survey the Nucleolus.
Kraft LJ, Manral P, Dowler J, Kenworthy AK. Kraft LJ, et al. Traffic. 2016 Apr;17(4):369-99. doi: 10.1111/tra.12372. Epub 2016 Feb 18. Traffic. 2016. PMID: 26728248 Free PMC article.
References
- Bessonov S., Anokhina M., Krasauskas A., Golas M.M., Sander B., Will C.L., Urlaub H., Stark H., Lührmann R. 2010. Characterization of purified human Bact spliceosomal complexes reveals compositional and morphological changes during spliceosome activation and first step catalysis. RNA. 16:2384–2403. 10.1261/rna.2456210 - DOI - PMC - PubMed
Publication types
MeSH terms
Substances
Grants and funding
- R01 CA113381/CA/NCI NIH HHS/United States
- P30 CA016672/CA/NCI NIH HHS/United States
- R01 CA092312/CA/NCI NIH HHS/United States
- CA016672/CA/NCI NIH HHS/United States
- P30CA125123/CA/NCI NIH HHS/United States
- R01 CA089239/CA/NCI NIH HHS/United States
- P30 HD024064/HD/NICHD NIH HHS/United States
- CA113381/CA/NCI NIH HHS/United States
- CA089239/CA/NCI NIH HHS/United States
- R01 GM095599/GM/NIGMS NIH HHS/United States
- 5P30HD024064/HD/NICHD NIH HHS/United States
- GM095599/GM/NIGMS NIH HHS/United States
- CA092312/CA/NCI NIH HHS/United States
- P30 CA125123/CA/NCI NIH HHS/United States
LinkOut - more resources
Full Text Sources
Other Literature Sources


