High-resolution characterization of CPD hotspot formation in human fibroblasts - PubMed (original) (raw)
High-resolution characterization of CPD hotspot formation in human fibroblasts
Anamaria G Zavala et al. Nucleic Acids Res. 2014 Jan.
Abstract
Repair of DNA lesions must occur within the chromatin landscape and is associated with alterations in histone modifications and nucleosome rearrangement. To directly associate these chromatin features with DNA damage and repair, it is necessary to be able to map DNA adducts. We have developed a cyclobutane pyrimidine dimer (CPD)-specific immunoprecipitation method and mapped ultraviolet damage hotspots across human chromosomes 1 and 6. CPD hotspots occur almost equally in genic and intergenic regions. However, these hotspots are significantly more prevalent adjacent to repeat elements, especially Alu repeats. Nucleosome mapping studies indicate that nucleosomes are consistently positioned at Alu elements where CPD hotspots form, but by 2 h post-irradiation, these same regions are significantly depleted of nucleosomes. These results indicate that nucleosomes associated with hotspots of CPD formation are readily rearranged, potentially making them accessible to DNA repair machinery. Our results represent the first chromosome scale map of ultraviolet-induced DNA lesions in the human genome, and reveal the sequence features and dynamic chromatin changes associated with CPD hotspots.
Figures
Figure 1.
UV-specific DNA immunoprecipitation. (A) DNA was isolated from NHF1-tert cells and UV irradiated to 12 J/m2 before immunoprecipitation with CPD-specific monoclonal antibodies. Slot blots were probed with anti-CPD antibodies. Blots were stripped and reprobed with 32P-labeled genomic DNA to determine DNA loading. Slot blot signals were normalized against signals from the genomic Southerns. (B) Relative enrichment of CPD signal in immunoprecipitated samples. (C) Isolated DNA was irradiated with 10, 50 and 100 J/m2 UV before immunoprecipitation with (+) and without (−) CPD-specific antibody. Slot blots and signal normalization was performed as described earlier. (D) Relative enrichment of CPD signal in immunoprecipitated samples.
Figure 2.
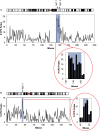
CPD hotspots mapped across chromosomes 1 and 6. NHF1-tert cells were UV irradiated at 12 J/m2. Isolated DNA was sheared and denatured before CPD-specific immunoprecipitation. Affymetrix Genechip tiling arrays 2.0 were probed with input and irradiated and unirradiated pulldown fractions. CPD hotspots were defined as peaks enriched at least 3-fold above input samples and at least 2-fold greater than unirradiated control samples. CPDs per megabase were mapped across (A) chromosome 1 and (B) chromosome 6.
Figure 3.
CPD hotspot association with genomic regions. CPD hotspot association with introns, exons and intergenic regions was determined based on NCBIv36/hg18 RefSeq genome annotation. Significant differences between observed and random datasets are denoted by *P < 0.001.
Figure 4.
CPD hotspots form preferentially at repeat regions. (A) Representative association of CPD hotspot (green bars) compared with unirradiated DNA (red bars) at a repeat element on chromosome 6. Peaks were visualized using CisGenome software. Alu repeat elements are represented by blue bars. Gaps indicate masked repeat regions, which are not covered by probes. (B) CPD hotspot association with repeat elements was determined by comparing the chromosomal location of masked repeats (as determined by RepeatMasker) with the maximum MA score of identified CPD hotspots. CPD hotspots were determined to be associated with repeats if the maximum MA score of the CPD hotspot fell within 100 bp of the end of the masked repeat element. Average probe intensity at CPD hotspots was graphed for SINE (blue), LINE (black), and LTR (green) repeat elements. The edges of the masked repeat element are represented at 0 flanking probe number. Solid lines represent the side of the repeat with maximum probe intensity (Max.), whereas dashed lines correspond to the side of the repeat with lower probe intensity (Min.). Peak probe intensity of repeat elements significantly associated with CPD hotspots (SINE and LINE) consistently occurs unilaterally (Max.) within one probe length of the masked repeat. (C) CPD hotspot and random simulation associations with SINE, LINE, LTR and Alu repeat elements. Associations were determined to be significant compared with random simulations as described earlier. Significant differences are denoted by *P < 0.001. (D) CPD hotspot association at repeat elements and non-repetitive sequences. CPD hotspot association was further refined to characterize CPD hotspots associated with Alu repeats. Alu repeats were subdivided into polydT or non-polydT repeats. PolydT repeats contain 10-bp regions with at least 90% dTs.
Figure 5.
qPCR confirmation of identified CPD hotspots. Microarray-based CPD association with Alu repeats was confirmed by qPCR for regions associated with hotspots and a region not associated with a hotspot. Percentage input was determined for IPs of irradiated and unirradiated samples with and without CPD-specific antibody.
Figure 6.
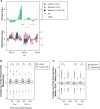
Nucleosome occupancy and remodeling at CPD hotspots. NHF1 cells were collected immediately before irradiation (0 J/m2; 0 JIP/0 Jinput) or irradiated with 12 J/m2 UV and collected at 2 h post-irradiation (12 J/m2; 12 JIP/12 Jinput). Chromatin was MNase digested and mononucleosome DNA was isolated and used to probe microarrays. (A) Representative CisGenome image of a CPD hotspot (green), nucleosome occupancy immediately before irradiation (pink) and nucleosome occupancy after 2 h of repair (black) on chromosome 6. Alu and LINE repeat elements are represented by blue and yellow bars, respectively. (B) Average nucleosome occupancy probe intensity ratios (log2) were calculated for the identified CPD hotspots associated with repeat elements for unirradiated (0 J/m2 IP/0 J input) and irradiated (12 J/m2 IP/12 J input) MNase datasets. Significant differences (*) between the nucleosome occupancy of the 0 J/m2 and 12 J/m2 samples were identified (Wilcoxon rank-sum test; P < 1 e-9). (C) Change in nucleosome occupancy probe intensity ratios (log2) was calculated for identified CPD hotspots and random regions associated with repeat elements in unirradiated and irradiated samples (MNase 12 J/m2/MNase 0 J/m2). Significant differences (*) between the nucleosome occupancy of the 0 J/m2 and 12 J/m2 samples were identified (Wilcoxon rank-sum test; P < 1 e-9).
Similar articles
- Modulation of cyclobutane pyrimidine dimer formation in a positioned nucleosome containing poly(dA.dT) tracts.
Schieferstein U, Thoma F. Schieferstein U, et al. Biochemistry. 1996 Jun 18;35(24):7705-14. doi: 10.1021/bi953011r. Biochemistry. 1996. PMID: 8672471 - Rotational position of a 5-methylcytosine-containing cyclobutane pyrimidine dimer in a nucleosome greatly affects its deamination rate.
Song Q, Cannistraro VJ, Taylor JS. Song Q, et al. J Biol Chem. 2011 Feb 25;286(8):6329-35. doi: 10.1074/jbc.M110.183178. Epub 2010 Dec 15. J Biol Chem. 2011. PMID: 21160086 Free PMC article. - Chromosomal landscape of UV damage formation and repair at single-nucleotide resolution.
Mao P, Smerdon MJ, Roberts SA, Wyrick JJ. Mao P, et al. Proc Natl Acad Sci U S A. 2016 Aug 9;113(32):9057-62. doi: 10.1073/pnas.1606667113. Epub 2016 Jul 25. Proc Natl Acad Sci U S A. 2016. PMID: 27457959 Free PMC article. - Nucleosome positioning, nucleotide excision repair and photoreactivation in Saccharomyces cerevisiae.
Guintini L, Charton R, Peyresaubes F, Thoma F, Conconi A. Guintini L, et al. DNA Repair (Amst). 2015 Dec;36:98-104. doi: 10.1016/j.dnarep.2015.09.012. Epub 2015 Sep 16. DNA Repair (Amst). 2015. PMID: 26429065 Review. - Open, repair and close again: chromatin dynamics and the response to UV-induced DNA damage.
Palomera-Sanchez Z, Zurita M. Palomera-Sanchez Z, et al. DNA Repair (Amst). 2011 Feb 7;10(2):119-25. doi: 10.1016/j.dnarep.2010.10.010. Epub 2010 Dec 3. DNA Repair (Amst). 2011. PMID: 21130713 Review.
Cited by
- Transcriptional repressor ZBTB1 promotes chromatin remodeling and translesion DNA synthesis.
Kim H, Dejsuphong D, Adelmant G, Ceccaldi R, Yang K, Marto JA, D'Andrea AD. Kim H, et al. Mol Cell. 2014 Apr 10;54(1):107-118. doi: 10.1016/j.molcel.2014.02.017. Epub 2014 Mar 20. Mol Cell. 2014. PMID: 24657165 Free PMC article. - Chromatin dynamics after DNA damage: The legacy of the access-repair-restore model.
Polo SE, Almouzni G. Polo SE, et al. DNA Repair (Amst). 2015 Dec;36:114-121. doi: 10.1016/j.dnarep.2015.09.014. Epub 2015 Sep 15. DNA Repair (Amst). 2015. PMID: 26429064 Free PMC article. Review. - Human genome-wide repair map of DNA damage caused by the cigarette smoke carcinogen benzo[a]pyrene.
Li W, Hu J, Adebali O, Adar S, Yang Y, Chiou YY, Sancar A. Li W, et al. Proc Natl Acad Sci U S A. 2017 Jun 27;114(26):6752-6757. doi: 10.1073/pnas.1706021114. Epub 2017 Jun 12. Proc Natl Acad Sci U S A. 2017. PMID: 28607059 Free PMC article. - Methodologies for detecting environmentally induced DNA damage and repair.
Li W, Sancar A. Li W, et al. Environ Mol Mutagen. 2020 Aug;61(7):664-679. doi: 10.1002/em.22365. Epub 2020 Feb 29. Environ Mol Mutagen. 2020. PMID: 32083352 Free PMC article. Review. - Dynamic maps of UV damage formation and repair for the human genome.
Hu J, Adebali O, Adar S, Sancar A. Hu J, et al. Proc Natl Acad Sci U S A. 2017 Jun 27;114(26):6758-6763. doi: 10.1073/pnas.1706522114. Epub 2017 Jun 12. Proc Natl Acad Sci U S A. 2017. PMID: 28607063 Free PMC article.
References
- Hanawalt PC. Genomic instability: environmental invasion and the enemies within. Mutat. Res. 1998;400:117–125. - PubMed
- Douki T, Cadet J. Individual determination of the yield of the main UV-induced dimeric pyrimidine photoproducts in DNA suggests a high mutagenicity of CC photolesions. Biochemistry. 2001;40:2495–2501. - PubMed
- Tornaletti S, Rozek D, Pfeifer GP. The distribution of UV photoproducts along the human p53 gene and its relation to mutations in skin cancer. Oncogene. 1993;8:2051–2057. - PubMed
- Smerdon MJ, Conconi A. Modulation of DNA damage and DNA repair in chromatin. Prog. Nucleic Acid Res. Mol. Biol. 1999;62:227–255. - PubMed
Publication types
MeSH terms
Substances
LinkOut - more resources
Full Text Sources
Other Literature Sources


