Targeted DNA methylation by homology-directed repair in mammalian cells. Transcription reshapes methylation on the repaired gene - PubMed (original) (raw)
doi: 10.1093/nar/gkt920. Epub 2013 Oct 16.
Tiziana Angrisano, Giusi Russo, Rosaria Landi, Antonio Pezone, Silvia Bartollino, Candida Zuchegna, Federica Babbio, Ian Marc Bonapace, Brittany Allen, Mark T Muller, Lorenzo Chiariotti, Max E Gottesman, Antonio Porcellini, Enrico V Avvedimento
Affiliations
- PMID: 24137009
- PMCID: PMC3902918
- DOI: 10.1093/nar/gkt920
Targeted DNA methylation by homology-directed repair in mammalian cells. Transcription reshapes methylation on the repaired gene
Annalisa Morano et al. Nucleic Acids Res. 2014 Jan.
Abstract
We report that homology-directed repair of a DNA double-strand break within a single copy Green Fluorescent Protein (GFP) gene in HeLa cells alters the methylation pattern at the site of recombination. DNA methyl transferase (DNMT)1, DNMT3a and two proteins that regulate methylation, Np95 and GADD45A, are recruited to the site of repair and are responsible for selective methylation of the promoter-distal segment of the repaired DNA. The initial methylation pattern of the locus is modified in a transcription-dependent fashion during the 15-20 days following repair, at which time no further changes in the methylation pattern occur. The variation in DNA modification generates stable clones with wide ranges of GFP expression. Collectively, our data indicate that somatic DNA methylation follows homologous repair and is subjected to remodeling by local transcription in a discrete time window during and after the damage. We propose that DNA methylation of repaired genes represents a DNA damage code and is source of variation of gene expression.
Figures
Figure 1.
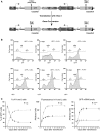
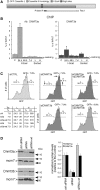
HDR generates high and low GFP-expressing clones. (A) Structure of the integrated tester DRGFP plasmid before and after repair. The structure of the plasmid (10,11) has been verified by sequence analysis. The boxes and arrows with different grayscales represent the structural elements of the integrated nonrecombinant (upper) and recombinant (lower) plasmid. The conversion of the I-SceI to BcgI restriction site marks the gene conversion event driven by the copy of GFP gene located at the 3′ end of DRGFP (cassette II). (B) Generation and accumulation of high (H) and low (L) expressor cells following homologous repair. Kinetics of L and H clones accumulation. Cells containing a single copy of DRGFP (clones 3 and 4, see ‘Materials and Methods’ section) or pool of clones (shown here), characterized as described in ‘Materials and Methods’ section, were transfected with I-SceI and subjected to FACS analysis at the times indicated. GFP positive (GFP+) cells were identified by the R1 gate (see
Supplementary Figure S3A
) on a bivariate plot (FL1H versus FL2H) after I-SceI transfection. A representative experiment, displaying the L and H cells is shown. Each panel shows (i) the days after I-SceI transfection; (ii) total GFP positive cells (%); (iii) the range gates used to discriminate H and L cells; (iv) the ratio L/H, which reached a plateau 7–14 days after I-SceI transfection. Panel (C): the number (percent of total GFP+ cells, left) and the fluorescence intensity (mean, center) of H and L cells derived from clones (not shown here) or pool of clones, based on at least five independent experiments. After 7–14 days, the L/H ratio and the intensity of L and H peaks stabilize. CMV–EGFP transfected cells, as control lines, display a single fluorescence peak (9). The right panel shows the relative levels, normalized to 18 S RNA, of nonrecombinant (UnRec) and recombinant (Rec) GFP mRNA after I-SceI transfection (see ‘Materials and Methods’ section).
Figure 2.
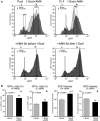
Synchronization of transcription by α-amanitin during repair amplifies and consolidates L and H clones. (A) Cytofluorimetric analysis. Cells were exposed to α-amanitin before, during or after I-SceI transfection as indicated on the top of each panel. A pool of HeLa DRGFP cells or a clone carrying a single insert were transfected with I-SceI expression vector, and 24 h later, an aliquot was exposed for 24 h to 2.5 µM α-amanitin. The cells were washed and cultured in normal medium for 5 days, when FACS analysis was carried out (day 7 after I-SceI transfection). The fluorescence plots of GFP positive cells (overlay of the histograms of RI gates, see
Supplementary Figure S3
) are shown. L and H represent the range gates to identify high and low expressors, respectively. The arrows, indicated by AMA, represent the shift of the mean fluorescence after α-amanitin treatment. Differences between treatments were tested for statistical significance using Student’s matched pairs t test: *P < 0.001, **P < 0.05. Under these conditions, α-amanitin did not affect cell survival or growth rate. Five days after 24-h 2.5 -µM α-amanitin treatment, transcription of several housekeeping genes was similar to untreated controls. The changes of GFP expression following the short treatment(s) with the drug during repair (24 h after I-SceI transfection) were stable for up 3 months in culture. (B) Statistical analysis derived from 28 independent experiments, in which DRGFP cells were exposed to α-amanitin during repair as indicated above. The panel shows the statistical significance of the means ( ± SD). Differences between treatments were tested for statistical significance using Student’s matched pairs t test: *P < 0.001, **P < 0.05.
Figure 3.
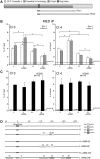
DNA methylation and chromatin modifications of the DSB region in cells exposed to α-amanitin during repair. (A) Location of Bcg, Rec1 and Rec2 primers, which recognize selectively recombinant GFP. Cassette I and II refer to Figure 1. (B) MEDIP with anti-5mC antibodies of recombinant GFP gene. Clones 3 and 4 were treated with α-amanitin for 24 h as described in Figure 2 and sorted 5 days after I-SceI as described in ‘Materials and Methods’ section. Content of 5mC is higher in L cells compared with H cells, α-amanitin also increases the levels of 5mC in L cells and lowers them in H cells. The results are similar for both amplicons (REC1 and REC2). All data derive from three independent experiments performed in triplicate (mean ± SD; n = 9). Differences between treatments were tested for statistical significance using Student’s matched pairs t test: *P < 0.01 as compared with the each control (α-amanitin treated versus untreated cells). Differences between cells (H versus L) were tested for statistical significance using Student’s t test: P < 0.01. (C) MEDIP analysis of the methylated H19 DMR (differentially methylated region) and the hypomethylated UBE2B genes in clone 3 and 4, treated with α-amanitin, as indicated in B. Longer exposure (48 h) to α-amanitin did not significantly alter the methylation pattern seen at 6 or 24 h assayed by bisulfite analysis (
Supplementary Figure S4
). (D) Bisulfite protection of GFP chromatin in L and H cells. Clone 4 cells were treated with α-amanitin for 6 or 24 h after transfection and sorted as indicated in ‘Materials and Methods’ section. Chromatin was purified as described in ‘Materials and Methods’ section, denatured and treated with sodium bisulfite. DNA was extracted, amplified, cloned in TOPO TA vector and sequenced. The amplified segment corresponds to the Rec1 region and primers were designed for the bisulfite-converted (+) strand. The boxes represent stretches of nonconverted dCs present in the GFP sequence. At least 15 independent GFP molecules were analyzed for each treatment, including cells not exposed to I-SceI (C). The numbers with the grayscale boxes represent the percentage of the molecules protected from bisulfite conversion in the regions indicated by boxes. The scale shows the coordinates of the GFP sequence relative to the DSB (indicated as 0 or I-SceI/BcgI site).
Figure 4.
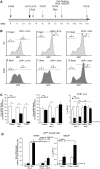
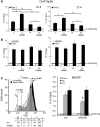
Transient exposure of recombinant cells to Actinomycin D increases methylation of the repaired gene. Panel (A) shows the time frame of actinomycin-D (Act-D) treatment and the assays performed. The cells were transfected with I-SceI expression vector and 72 h later were exposed to Act-D (0.05 mg/ml) for 6 h. Act-D did not induce detectable modifications of the cell cycle by PI analysis (G1 50 ± 2 versus 50 ± 3; S 23 ± 1.2 versus 25 ± 1.6; G2/M 27 ± 1.6 versus 25 ± 1.8 in the presence of 6 h Act-D); the cells were viable and RNA polymerase II was depleted from the chromatin. Five days after the treatment, the recombination frequency, measured by qPCR and GFP transcription were comparable between treated and untreated cells. The arrows indicate the time window of RNA analysis, MEDIP, FACS and cell sorting, relative to I-SceI transfection. (B) FACS analysis (a representative of five independent experiments) was performed as described in Figure 1 at 5, 7 and 12 days after I-SceI transfection (2, 4 and 9 days after Act-D treatment, respectively). Panel (C) Left. GFP mRNA accumulation assayed by qPCR after Act-D treatment (3 days after I-SceI transfection and 10 h after Act-D, or 7 days after I-SceI and 96 h after Act-D) normalized to 18 S RNA. Recombinant (Rec) and nonrecombinant (UnRec) mRNA levels are expressed as percent of untreated levels ± SD because the absolute mRNA levels cannot be compared because of the differences of the efficiency of the primers. The same results were obtained normalizing GFP RNA to GAPDH mRNA. Differences between treatments were tested for statistical significance using Student’s matched pairs t test: *P < 0.01 as compared with the each untreated control. Right. RNA polymerase II recruitment on recombinant and nonrecombinant GFP chromatin after Act-D treatment. ChIP with anti-Pol II large fragment antibodies of chromatin extracted from Act-D–treated cells 3 days after I-SceI transfection (10 h after Act-D) or 7 days after I-SceI (96 h after Act-D). *P < 0.01 compared with the each untreated control; **P < 0.01, 3 days compared to 7 days time point; the average of immunoprecipitated DNA with a control Ig is reported on the bar graph. (D) GFP mRNA levels and MEDIP assay at day 8 on sorted GFP+ cells. Left: Recombinant (Rec) and nonrecombinant (UnRec) primers were used to quantify GFP mRNA by qPCR and to measure the contamination of nonrecombinant GFP negative cells. The values were normalized to GAPDH (white columns) or 18 S (black columns) RNAs. Rec mRNA levels are shown as percent of the levels found in control cells (I-SceI transfected/Act-D untreated cells); UnRec mRNA levels are expressed as percent of control (untransfected DRGFP cells) (mean of three experiments in triplicate ± SD). *P < 0.01 as compared with untreated control. Right: 5mC content was carried out on sorted GFP+ cells (H and L) as indicated in panel A. Specifically, we analyzed the 5mC content of (i) a segment of the GFP promoter, 1 kb upstream the DSB (oligo b and c, see
Supplementary Table S1
); (ii) the region 3′ to the DSB, which was methylated by HDR; and (iii) H19 and UE2B genes, as controls of hypermethylated and undermethylated genes, respectively, and to monitor the efficiency of MEDIP assays. The 5mC levels in these regions, except the segment 3′ to the DSB, were not modified by 6 h Act-D treatment (data not shown). 5mC levels are expressed as percentage of input (mean ± SD of three experiments in triplicate); the average of immunoprecipitated DNA with a control Ig is reported on the bar graph. *P < 0.01 as compared with the each untreated control. Act-D, administered 27, 30 and 35 days after I-SceI for 6 h, transiently inhibited transcription, but did not change GFP gene methylation.
Figure 5.
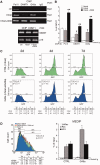
DNMT3a and 3b are recruited to the DSB early during repair, but only DNMT3a is necessary for generation of L cells (A and B) Recruitment of DNMT3a, DNMT3b to the I-SceI chromatin. Cells were transfected with I-SceI and 24 h, 48 h or 7 days later, were fixed, collected, chromatin-extracted and subjected to ChIP analysis with specific anti-DNMT3a and DNMT3b antibodies. The specific primers used to amplify the GFP cassette I are indicated in (A). Data represent the fraction of immunoprecipitated DNA relative to the input chromatin-DNA present in the reactions (% of input; mean ± SD; n ≥ 9); the average of immunoprecipitated DNA with a control Ig is reported on each bar graph. *P < 0.01, paired t test. (C) Silencing the expression of DNMT3a reduces L cells. Cells were electroporated with the siRNA targeting DNMT3a and DNMT3b (see ‘Materials and Methods’ section and protocol S1) and analyzed 7 days later, when L and H cells were clearly separated. On the bottom left panel, statistical analysis derived from three independent experiments is shown. *P < 0.01, paired _t_-test comparing GFP intensity, Chi Square (χ2) comparing the percentage of L/H cells. The horizontal and vertical arrows in the central inset indicate the shift in fluorescence intensity and in the distribution of L and H cells, respectively. Treatment with 5azadC (10 µM for 2 days, 48 h after I-SceI transfection) rescued completely the loss of L cells (intensity and % GFP+ cells) induced by DNMT3a overexpression in siDNMT3a-silenced cells (data not shown). (D) Western blot analysis of DNMT3a and 3 b in silenced cells. Total cell extracts were prepared 48 h after electroporation and analyzed by immunoblot with the specific antibodies indicated. On the right is shown quantitative analysis derived from three immunoblots (mean ± SD).
Figure 6.
Np95 (UHRF1) is recruited to repaired GFP and stimulates DNA methylation. (A) ChIP with anti-Np95 antibodies of sorted cells exposed to α-amanitin during repair. Clones 3 and 4 were transfected with I-SceI and treated with α-amanitin for 24 h as described in Figure 2. The cells were sorted 5 days after I-SceI transfection and chromatin was collected from formaldehyde-fixed cells and subjected to ChIP analysis with specific antibodies to Np95. Primers Bcg and Rec2 were used to amplify recombinant GFP DNA. The data derive from three independent experiments performed in triplicate (mean ± SD; n = 9). Differences between treatments were tested for statistical significance using Student’s matched pair _t_-test: *P < 0.01 as compared with the each control (α-amanitin treated versus untreated cells). Differences between cells (H versus L) were tested for statistical significance using Student’s _t_-test: **P < 0.01. (B) ChIP analysis of Np95 on H19 DMR and UBE2B genes. qPCR was carried out with specific H19 DMR and UBE2B primers on the same samples indicated above. The fraction of immunoprecipitated DNA by control Ig is reported on each bar graph. (C) DRGFP cells (pool of clones; clone 3 and 4 are not shown here) were transiently transfected with a mixture of siRNAs targeting specifically human NP95 or control scrambled siRNA (ctrl) and the mouse I-SceI expression vector (see ‘Materials and Methods’ section). Six days later, the cells were subjected to FACS analysis and MEDIP. The left panel shows a representative experiment: arrows indicate the shift in silenced cells of GFP fluorescence intensity. The columns below the fluorescence plot show (i) the number of GFP+ cells (Tot, expressed as percentage of cells); (ii) the mean fluorescence intensity (Int.); and (iii) Percentage of L and H cells on GFP+ cells. Mean fluorescence intensity at day 7 increased from 10 to 37 in L cells and from 336 to 460 in H cells (left panel). FACS analysis was performed in triplicate in at least three experiments. Differences between treatments were tested for statistical significance using Student’s matched pair _t_-test: *P < 0.001 as compared with the each control (siRNA-treated versus untreated cells). Samples expressing NP95 wild-type and control cells were treated with 1 µM 5azadC for 1 day (48 h after I-SceI), and the differences in fluorescence intensity was used to quantify methylation-dependent changes of GFP expression. The panel on the right shows the results of MEDIP immunoprecipitation with anti-5mC antibodies in control and siRNA-treated samples. Np95 depletion by siRNA did not modify the methylation status of stably methylated genes, such as H19 (DMR) and β-actin CpG island. *P < 0.01 for _t_-value (matched pair test) relative to the cells treated with control scramble siRNA (CTRL). Data are expressed as mean ± SD, n = 9; the average of immunoprecipitated DNA with a control Ig is reported on the bar graph.
Figure 7.
GADD45 is recruited to the DSB and transiently inhibits de novo methylation induced by HDR. (A) ChIP analysis with anti-GADD45A, DNMT1 and RNA polymerase II large fragment antibodies in HeLa cells, transfected (36 h) with I-SceI. Twelve hours after transfection, an aliquot of cells was treated for 24 h with α-amanitin and processed as described in ‘Materials and Methods’ section. Bcg and Rec1 primers were used for semiquantitative PCR. Two methylated genes, MGM and p16, were used as controls for DNMT1 ChIP. Control IgG represents an average of nonimmune immunoglobulins used in ChIP. (B) Quantitative analysis by qPCR of at least three ChIP experiments in triplicate (n ≥ 9). Differences between treatments were tested for statistical significance using Student’s matched pairs _t_-test: *P < 0.01 as compared with uncleaved control; **P < 0.01 compared with I-SceI. The average of immunoprecipitated DNA with a nonimmune Ig is reported on the bar graph. (C) DRGFP cells (pool of clones) were transiently transfected with siRNA pools targeting specifically GADD45A or control scrambled siRNA (ctrl) and the I-SceI expression vector (see ‘Materials and Methods’ section). After 2, 4 and 7 days, the cells were subjected to FACS analysis as described in Figure 1. FACS analysis was performed in triplicate in at least three experiments. Differences in GFP expression between control and GADD45A-silenced cells were tested for statistical significance using the Chi Square test, T(X) (Population Comparison module of the FlowJo software from Tree Star). Differences of L and H (percentage and intensity) were tested for statistical significance using Student’s t test: *P < 0.01 (see
Supplementary Figure S10
). χ2 value (4.7), 2 days after I-SceI (control and GADD45A-silenced cells) (P < 0.01); at day 4 and 7, χ2 value was not discriminant as day 2, although differences in fluorescence intensity of L an H cells between the control and GADD45A-silenced cells were significant (P < 0.02). All samples were treated with 1 µM 5azadC for 1 day (48 h after I-SceI) to quantify methylation-dependent changes. (D) Left panel. Forced expression of GADD45A increases GFP expression. Cells were exposed to siRNA targeting the 3′ UTR human GADD45A alone or in combination with vector expressing GADD45A. GFP fluorescence and Rec mRNA were analyzed 4 days later. The levels of specific GADD45A mRNA, the frequency of recombination in GADD45A-depleted cells and the statistical analysis of GFP expression are shown in
Supplementary Figure S8
. Differences between populations (control and GADD45A-silenced cells) were tested for statistical significance using the Chi Square test (Population Comparison module of the FlowJo software). Cells expressing CMV-EGFP–treated with etoposide or transfected with Ga45a expressing vector did not change GFP expression. Right panel. 5mC content of recombinant GFP in cells silenced for GADD45A. Four days after transfection, the cells were subjected to MEDIP assay. GADD45A depletion by siRNA did not modify the methylation status of stably methylated genes, such as H19 (DMR) and β-actin CpG island. *P < 0.01 for t value (matched pair test) relative to cells treated with control scramble siRNA (CTRL). All the samples in independent experiments were treated with 1 µM 5azadC for 1 day (48 h after I-SceI) to quantify methylation-dependent changes. The average of immunoprecipitated DNA with a control Ig is reported.
Figure 8.
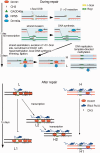
Targeted methylation during and after homologous repair. The cartoon represents a schematic model illustrating the events during and after repair. The DSB undergoes 5′ –> 3′ end resection and one of the 3′ free single strand end invades the DNA of the GFP cassette II. The half I-SceI site is removed (flap removal) and new DNA is synthesized. Eventually, the invading strand returns to the original configuration and directs the synthesis of new DNA at the BcgI site corresponding to the DSB, according to the SDSA model (
S
ynthesis
D
irected
S
trand
A
nnealing) (31). We propose that the asymmetric distribution of methylated CpGs in repaired GFP is caused by selective invasion of the (+) strand. The (−) strand, blocked by stalled RNA Pol II (DNMT1 and 3 a), becomes a preferential target of DNMT1-Np95. The hemi-methylated DNA is replicated and generates H and L cells. After repair, transcription resumes and RNA Pol II-DNMT1 is associated with methylation/demethylation cycles (32) that in 15 days may remove some methyl groups in a subpopulation of L cells, leading to the conversion of L2 to H 2 cells.
Similar articles
- GADD45α inhibition of DNMT1 dependent DNA methylation during homology directed DNA repair.
Lee B, Morano A, Porcellini A, Muller MT. Lee B, et al. Nucleic Acids Res. 2012 Mar;40(6):2481-93. doi: 10.1093/nar/gkr1115. Epub 2011 Dec 1. Nucleic Acids Res. 2012. PMID: 22135303 Free PMC article. - DNA damage, homology-directed repair, and DNA methylation.
Cuozzo C, Porcellini A, Angrisano T, Morano A, Lee B, Di Pardo A, Messina S, Iuliano R, Fusco A, Santillo MR, Muller MT, Chiariotti L, Gottesman ME, Avvedimento EV. Cuozzo C, et al. PLoS Genet. 2007 Jul;3(7):e110. doi: 10.1371/journal.pgen.0030110. PLoS Genet. 2007. PMID: 17616978 Free PMC article. - Np95 interacts with de novo DNA methyltransferases, Dnmt3a and Dnmt3b, and mediates epigenetic silencing of the viral CMV promoter in embryonic stem cells.
Meilinger D, Fellinger K, Bultmann S, Rothbauer U, Bonapace IM, Klinkert WE, Spada F, Leonhardt H. Meilinger D, et al. EMBO Rep. 2009 Nov;10(11):1259-64. doi: 10.1038/embor.2009.201. Epub 2009 Oct 2. EMBO Rep. 2009. PMID: 19798101 Free PMC article. - Chromatin modification and NBS1: their relationship in DNA double-strand break repair.
Saito Y, Zhou H, Kobayashi J. Saito Y, et al. Genes Genet Syst. 2016;90(4):195-208. doi: 10.1266/ggs.15-00010. Epub 2015 Nov 25. Genes Genet Syst. 2016. PMID: 26616756 Review. - The MRE11 complex: A versatile toolkit for the repair of broken DNA.
Reginato G, Cejka P. Reginato G, et al. DNA Repair (Amst). 2020 Jul-Aug;91-92:102869. doi: 10.1016/j.dnarep.2020.102869. Epub 2020 May 15. DNA Repair (Amst). 2020. PMID: 32480356 Review.
Cited by
- Mechanisms of DNA Methyltransferase Recruitment in Mammals.
Laisné M, Gupta N, Kirsh O, Pradhan S, Defossez PA. Laisné M, et al. Genes (Basel). 2018 Dec 10;9(12):617. doi: 10.3390/genes9120617. Genes (Basel). 2018. PMID: 30544749 Free PMC article. Review. - Tracing and tracking epiallele families in complex DNA populations.
Pezone A, Tramontano A, Scala G, Cuomo M, Riccio P, De Nicola S, Porcellini A, Chiariotti L, Avvedimento EV. Pezone A, et al. NAR Genom Bioinform. 2020 Nov 16;2(4):lqaa096. doi: 10.1093/nargab/lqaa096. eCollection 2020 Dec. NAR Genom Bioinform. 2020. PMID: 33575640 Free PMC article. - Impact of differential DNA methylation on transgene expression in cotton (Gossypium hirsutum L.) events generated by targeted sequence insertion.
Verkest A, Bourout S, Debaveye J, Reynaert K, Saey B, den Brande IV, D'Halluin K. Verkest A, et al. Plant Biotechnol J. 2019 Jul;17(7):1236-1247. doi: 10.1111/pbi.13049. Epub 2019 Jan 19. Plant Biotechnol J. 2019. PMID: 30549163 Free PMC article. - Oxytetracycline induces DNA damage and epigenetic changes: a possible risk for human and animal health?
Gallo A, Landi R, Rubino V, Di Cerbo A, Giovazzino A, Palatucci AT, Centenaro S, Guidetti G, Canello S, Cortese L, Ruggiero G, Alessandrini A, Terrazzano G. Gallo A, et al. PeerJ. 2017 Apr 27;5:e3236. doi: 10.7717/peerj.3236. eCollection 2017. PeerJ. 2017. PMID: 28462039 Free PMC article. - DNA damage and Repair Modify DNA methylation and Chromatin Domain of the Targeted Locus: Mechanism of allele methylation polymorphism.
Russo G, Landi R, Pezone A, Morano A, Zuchegna C, Romano A, Muller MT, Gottesman ME, Porcellini A, Avvedimento EV. Russo G, et al. Sci Rep. 2016 Sep 15;6:33222. doi: 10.1038/srep33222. Sci Rep. 2016. PMID: 27629060 Free PMC article.
References
- Rizwana R, Hahn P. CpG methylation reduces genomic instability. J. Cell Sci. 1999;112:4513–4519. - PubMed
- Probst AV, Dunleavy E, Almouzni G. Epigenetic inheritance during the cell cycle. Nat. Rev. Mol. Cell Biol. 2009;10:192–206. - PubMed
- Avvedimento EV, Obici S, Sanchez M, Gallo A, Musti A, Gottesman ME. Reactivation of thyroglobulin gene expression in transformed thyroid cells by 5-azacytidine. Cell. 1989;58:1135–1142. - PubMed
Publication types
MeSH terms
Substances
LinkOut - more resources
Full Text Sources
Other Literature Sources
