Indian signatures in the westernmost edge of the European Romani diaspora: new insight from mitogenomes - PubMed (original) (raw)
Indian signatures in the westernmost edge of the European Romani diaspora: new insight from mitogenomes
Alberto Gómez-Carballa et al. PLoS One. 2013.
Abstract
In agreement with historical documentation, several genetic studies have revealed ancestral links between the European Romani and India. The entire mitochondrial DNA (mtDNA) of 27 Spanish Romani was sequenced in order to shed further light on the origins of this population. The data were analyzed together with a large published dataset (mainly hypervariable region I [HVS-I] haplotypes) of Romani (N=1,353) and non-Romani worldwide populations (N>150,000). Analysis of mitogenomes allowed the characterization of various Romani-specific clades. M5a1b1a1 is the most distinctive European Romani haplogroup; it is present in all Romani groups at variable frequencies (with only sporadic findings in non-Romani) and represents 18% of their mtDNA pool. Its phylogeographic features indicate that M5a1b1a1 originated 1.5 thousand years ago (kya; 95% CI: 1.3-1.8) in a proto-Romani population living in Northwest India. U3 represents the most characteristic Romani haplogroup of European/Near Eastern origin (12.4%); it appears at dissimilar frequencies across the continent (Iberia: ≈ 31%; Eastern/Central Europe: ≈ 13%). All U3 mitogenomes of our Iberian Romani sample fall within a new sub-clade, U3b1c, which can be dated to 0.5 kya (95% CI: 0.3-0.7); therefore, signaling a lower bound for the founder event that followed admixture in Europe/Near East. Other minor European/Near Eastern haplogroups (e.g. H24, H88a) were also assimilated into the Romani by introgression with neighboring populations during their diaspora into Europe; yet some show a differentiation from the phylogenetically closest non-Romani counterpart. The phylogeny of Romani mitogenomes shows clear signatures of low effective population sizes and founder effects. Overall, these results are in good agreement with historical documentation, suggesting that cultural identity and relative isolation have allowed the Romani to preserve a distinctive mtDNA heritage, with some features linking them unequivocally to their ancestral Indian homeland.
Conflict of interest statement
Competing Interests: The authors have declared that no competing interests exist.
Figures
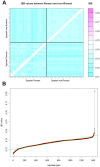
Figure 1. Analysis of IBS carried out on Romani and non-Romani individuals based on genome-wide SNP data.
(A) IBS values between Romani and non-Romani individuals. The non-Romani population sample was taken from the same Spanish region where the Romani samples were collected for the present study. The pink dots correspond to the two pairs of Romani individuals showing much higher IBS values than those observed between other Romani or non-Romani individuals. (B) All pairs of IBS values between Romani and non-Romani individuals are sorted from the lowest to the highest; the two highest values on the right of the figure correspond to the two pairs of Romani individuals in Figure 1A.
Figure 2. Maximum parsimony tree of haplogroup M5 Romani mitogenomes.
The inset map shows the geographic location and sample size of all the M5 genomes observed in India subcontinent. The position of the revised Cambridge reference sequence (rCRS) is indicated for reading sequence motifs . Mitochondrial DNA variants are indicated along the branches of the phylogenetic tree. An asterisk (*) as prefix indicates a position located in an overlapping region shared by two mtDNA genes. Mutations are transitions unless a suffix A, C, G, or T indicates a transversion. Other possible suffixes indicate insertions (+), synonymous substitution (s), mutational changes in tRNA (-t), mutational change in rRNA (-r), non-coding variant located in the mtDNA coding region (-nc) and an amino acid replacement (indicated in round brackets). Variants underlined represent recurrent mutations in this tree while a prefix ‘@’ indicates a back mutation. Mutational hotspot variants at positions 16182, 16183, and 16519, as well as variation around position 310 and length or point heteroplasmies were not considered for the phylogenetic reconstruction. The numbers in small squares attached to the haplogroup labels indicate the number of occurrences (mitogenomes) of the corresponding haplogroups found in public databases; the color of the squares indicates their geographic origin according to the legend inset. Spanish Romani complete genomes obtained in this study are indicated with yellow circles. More details on the geographic or ethnic origin of all the mitogenomes used in this network are provided in Table S1. The Indian M5a1b1a genome (FJ383591) seems to belong to M5a1b1a, but note that it lacks four diagnostic sites, most likely due to sequencing or documentation errors –.
Figure 3. Maximum parsimony tree of M5a1b1a1 HVS-I sequences.
Population codes are as follows: ALB = Albania; BOS = Bosnia; BRA = Brazil; BUL = Bulgaria; CRO = Croatia; CRZ = Czech Republic; CUB = Cuba; FIN = Finland; FRA = France; GER = Germany; GRE = Greece; HUN = Hungary; IND = India; ITA = Italy; LIT = Lithuania; PAK = Pakistan; POL = Poland; POR = Portugal; RUS = Russia; SLO = Slovakia; SPA = Spain; USA = United States of America. See Table S3 for detailed geographic information on these haplotypes. See caption to Figure 2 for more information on the features of the tree.
Figure 4. Map showing the frequency of haplogroup M5a1b1a1 control region sequences (pie charts) in different European Romani groups.
The inset map represents this clade as ultimately originated in India; the numbers in the green circles represent the occurrences of M5a1b1a in non-Romani individuals in Eurasia (see Table S3 for references): 24 incidences in Europe and 9 incidences in India. References for the European Romani groups (red squares in the map) are as follows: 1 = Bulgaria , ; 2 = Croatia ; 3 = Hungary ; 4 = Lithuania ; 5 = Poland ; 6 = Slovakia ; 7 = Portugal ; 8 = Málaga (Southern Spain) ; 9 = Madrid (Central Spain) ; 10 = Barcelona (Northeastern Spain) .
Figure 5. Maximum parsimony tree of haplogroup M35 mitogenomes.
The inset map shows the geographic location and sample size of all the M5 genomes observed in the Indian subcontinent. See caption to Figure 2 for more information on the features of the tree.
Figure 6. Maximum parsimony tree of the Spanish Romani mitogenomes analyzed in the present study excluding those belonging to haplogroup M5 ( Figure 2 ), and U3 ( Figure 7 ).
See the caption to Figure 2 for more information on the features of the tree.
Figure 7. Maximum parsimony tree of haplogroup U3 mitogenomes.
See caption to Figure 2 for more information on the features of the tree.
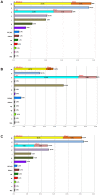
Figure 8. Mitochondrial DNA haplogroup frequencies.
(A) European Romani populations; (B) Iberian Romani; (C) European Romani excluding those from Iberia. Note that HV(×H) represents all haplogroups within HV excluding the H branch; L represents all mtDNA clades excluding macro-haplogroups M and N; and the category ‘other’ represents a paragroup that includes all of the haplotypes that could not be unambiguously assigned to any of the other categories considered in the figure.
Similar articles
- Founder lineages in the Iberian Roma mitogenomes recapitulate the Roma diaspora and show the effects of demographic bottlenecks.
Aizpurua-Iraola J, Giménez A, Carballo-Mesa A, Calafell F, Comas D. Aizpurua-Iraola J, et al. Sci Rep. 2022 Nov 4;12(1):18720. doi: 10.1038/s41598-022-23349-9. Sci Rep. 2022. PMID: 36333436 Free PMC article. - The phylogeography of Y-chromosome haplogroup h1a1a-m82 reveals the likely Indian origin of the European Romani populations.
Rai N, Chaubey G, Tamang R, Pathak AK, Singh VK, Karmin M, Singh M, Rani DS, Anugula S, Yadav BK, Singh A, Srinivasagan R, Yadav A, Kashyap M, Narvariya S, Reddy AG, van Driem G, Underhill PA, Villems R, Kivisild T, Singh L, Thangaraj K. Rai N, et al. PLoS One. 2012;7(11):e48477. doi: 10.1371/journal.pone.0048477. Epub 2012 Nov 28. PLoS One. 2012. PMID: 23209554 Free PMC article. - The role of the Vlax Roma in shaping the European Romani maternal genetic history.
Salihović MP, Barešić A, Klarić IM, Cukrov S, Lauc LB, Janićijević B. Salihović MP, et al. Am J Phys Anthropol. 2011 Oct;146(2):262-70. doi: 10.1002/ajpa.21566. Epub 2011 Aug 16. Am J Phys Anthropol. 2011. PMID: 21915846 - Reconstructing the population history of European Romani from genome-wide data.
Mendizabal I, Lao O, Marigorta UM, Wollstein A, Gusmão L, Ferak V, Ioana M, Jordanova A, Kaneva R, Kouvatsi A, Kučinskas V, Makukh H, Metspalu A, Netea MG, de Pablo R, Pamjav H, Radojkovic D, Rolleston SJ, Sertic J, Macek M Jr, Comas D, Kayser M. Mendizabal I, et al. Curr Biol. 2012 Dec 18;22(24):2342-9. doi: 10.1016/j.cub.2012.10.039. Epub 2012 Dec 6. Curr Biol. 2012. PMID: 23219723 - Mitochondrial DNA diversity in the Polish Roma.
Malyarchuk BA, Grzybowski T, Derenko MV, Czarny J, Miścicka-Sliwka D. Malyarchuk BA, et al. Ann Hum Genet. 2006 Mar;70(Pt 2):195-206. doi: 10.1111/j.1529-8817.2005.00222.x. Ann Hum Genet. 2006. PMID: 16626330
Cited by
- Population Genetics of the European Roma-A Review.
Ena GF, Aizpurua-Iraola J, Font-Porterias N, Calafell F, Comas D. Ena GF, et al. Genes (Basel). 2022 Nov 8;13(11):2068. doi: 10.3390/genes13112068. Genes (Basel). 2022. PMID: 36360305 Free PMC article. Review. - Founder lineages in the Iberian Roma mitogenomes recapitulate the Roma diaspora and show the effects of demographic bottlenecks.
Aizpurua-Iraola J, Giménez A, Carballo-Mesa A, Calafell F, Comas D. Aizpurua-Iraola J, et al. Sci Rep. 2022 Nov 4;12(1):18720. doi: 10.1038/s41598-022-23349-9. Sci Rep. 2022. PMID: 36333436 Free PMC article. - The genetic scenario of Mercheros: an under-represented group within the Iberian Peninsula.
Flores-Bello A, Font-Porterias N, Aizpurua-Iraola J, Duarri-Redondo S, Comas D. Flores-Bello A, et al. BMC Genomics. 2021 Dec 15;22(1):897. doi: 10.1186/s12864-021-08203-y. BMC Genomics. 2021. PMID: 34911433 Free PMC article. - Case Report: Two Monochorionic Twins With a Critically Different Course of Progressive Osseus Heteroplasia.
Justicia-Grande AJ, Gómez-Ríal J, Rivero-Calle I, Pischedda S, Curras-Tuala MJ, Gómez-Carballa A, Cebey-López M, Pardo-Seco J, Méndez-Gallart R, Fernández-Seara MJ, Salas A, Martinón-Torres F. Justicia-Grande AJ, et al. Front Pediatr. 2021 Jun 23;9:662669. doi: 10.3389/fped.2021.662669. eCollection 2021. Front Pediatr. 2021. PMID: 34249809 Free PMC article. - Sex-biased patterns shaped the genetic history of Roma.
García-Fernández C, Font-Porterias N, Kučinskas V, Sukarova-Stefanovska E, Pamjav H, Makukh H, Dobon B, Bertranpetit J, Netea MG, Calafell F, Comas D. García-Fernández C, et al. Sci Rep. 2020 Sep 2;10(1):14464. doi: 10.1038/s41598-020-71066-y. Sci Rep. 2020. PMID: 32879340 Free PMC article.
References
- Liégois JP (2007) Roms en Europe: Éditions du Conseil de l'Europe.
- Ioviţă R, Schurr TG (2004) Reconstructing the origins and migrations of diasporic populations: the case of the European gypsies. Am Anthropol 106: 267–281.
- Fraser A (1995) The gypsies; Wiley-Blackwell, editor. Oxford UK: Blackwell Publishers.
- Turner RL (1984) The position of Romani in Indo-Aryan: Monographs.
Publication types
MeSH terms
Substances
Grants and funding
The research leading to these results has received funding from the “Ministerio de Ciencia e Innovación” (SAF2008-02971) and from the Plan Galego IDT, Xunta de Galicia (EM 2012/045) (A.S.) and Consellería de Sanidade/Xunta de Galicia (RHI07/2-intensificación actividad investigadora and 10PXIB918184PR), Instituto Carlos III (Intensificación de la actividad investigadora) and Fondo de Investigación Sanitaria (FIS; PI070069 and PI1000540) del plan nacional de I+D+I and ‘fondos FEDER’ (F.M.T.). The funders had no role in study design, data collection and analysis, decision to publish, or preparation of the manuscript.
LinkOut - more resources
Full Text Sources
Other Literature Sources


