Massively parallel sequencing reveals an accumulation of de novo mutations and an activating mutation of LPAR1 in a patient with metastatic neuroblastoma - PubMed (original) (raw)
. 2013 Oct 16;8(10):e77731.
doi: 10.1371/journal.pone.0077731. eCollection 2013.
Peter Johansson, Li Chen, Young K Song, Catherine Tolman, Samuel Li, Laura Hurd, Rajesh Patidar, Xinyu Wen, Thomas C Badgett, Adam T C Cheuk, Jean-Claude Marshall, Patricia S Steeg, José P Vaqué Díez, Yanlin Yu, J Silvio Gutkind, Javed Khan
Affiliations
- PMID: 24147068
- PMCID: PMC3797724
- DOI: 10.1371/journal.pone.0077731
Massively parallel sequencing reveals an accumulation of de novo mutations and an activating mutation of LPAR1 in a patient with metastatic neuroblastoma
Jun S Wei et al. PLoS One. 2013.
Abstract
Neuroblastoma is one of the most genomically heterogeneous childhood malignances studied to date, and the molecular events that occur during the course of the disease are not fully understood. Genomic studies in neuroblastoma have showed only a few recurrent mutations and a low somatic mutation burden. However, none of these studies has examined the mutations arising during the course of disease, nor have they systemically examined the expression of mutant genes. Here we performed genomic analyses on tumors taken during a 3.5 years disease course from a neuroblastoma patient (bone marrow biopsy at diagnosis, adrenal primary tumor taken at surgical resection, and a liver metastasis at autopsy). Whole genome sequencing of the index liver metastasis identified 44 non-synonymous somatic mutations in 42 genes (0.85 mutation/MB) and a large hemizygous deletion in the ATRX gene which has been recently reported in neuroblastoma. Of these 45 somatic alterations, 15 were also detected in the primary tumor and bone marrow biopsy, while the other 30 were unique to the index tumor, indicating accumulation of de novo mutations during therapy. Furthermore, transcriptome sequencing on the 3 tumors demonstrated only 3 out of the 15 commonly mutated genes (LPAR1, GATA2, and NUFIP1) had high level of expression of the mutant alleles, suggesting potential oncogenic driver roles of these mutated genes. Among them, the druggable G-protein coupled receptor LPAR1 was highly expressed in all tumors. Cells expressing the LPAR1 R163W mutant demonstrated a significantly increased motility through elevated Rho signaling, but had no effect on growth. Therefore, this study highlights the need for multiple biopsies and sequencing during progression of a cancer and combinatorial DNA and RNA sequencing approach for systematic identification of expressed driver mutations.
Conflict of interest statement
Competing Interests: The authors have the following interests: Co-author Xinyu Wen is employed by FAIC-Frederick Inc. This does not alter the authors' adherence to all the PLOS ONE policies on sharing data and material.
Figures
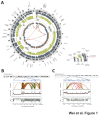
Figure 1. Whole genome sequencing of tumor Met2 and paired germline DNA revealed extensive somatic alterations in tumor DNA.
(A) A CIRCOS plot shows non-synonymous somatic mutations, copy number changes, lesser allele fraction, loss of heterozygosity (LOH), and abnormal junctions in the Met2 tumor genome. (B,C) Chromothripsis was evident by massive complex rearrangements detected at chromosomes 4q and 13p by whole genome sequencing. In the junction plots, black, green, and red lines represent deletions, tandem duplication, and inversion respectively. Each dot in the copy number and LAF plots represents a 2 kilobases DNA fragment, and red and green lines mark the average segmental copy number and LAF respectively. LAF, lesser allele fraction.
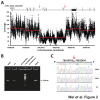
Figure 2. A focal hemizygous deletion in the ATRX gene in all three tumor samples.
(A) Base coverage of X chromosome from whole genome sequencing detected a hemizygous deletion in the ATRX genes from 76916706 to 76932433 (marked by red arrows). Each black dot represents a base, and red lines denote average coverage of each segment using circular binary segmentation[67]. Transcript NM_000489 was used for the exon annotation of the ATRX gene. (B) Genomic PCR verified the somatic deletion in the ATRX gene using a pair of genomic PCR primers flanking the predicted deleted region on the X chromosome. As result of the deletion, an abnormal PCR product of 220bp was detected in tumor DNAs, but not in the germline DNAs on a 2% TBE-agarose gel. (C) Sanger sequencing of the genomic PCR products confirmed the deletion of ChrX:76916706-76932433 was the same among all three tumors .
Figure 3. Transcriptome sequencing demonstrated that LPAR1 was the most highly expressed gene among the 15 commonly mutated genes.
(A) Expression of 15 commonly mutated genes. Upper panel, normalized expression at the gene level was plotted for the 15 shared mutant genes in reads per kilobases of exon per million mapped reads (RPKM). Most genes were expressed at similar levels among all three tumors and LPAR1 was the highest expressed mutant gene. Lower panel, fraction of mutant allele transcripts was calculated at the mutant positions for 14 commonly mutated genes. (B) Expression of 30 mutated genes unique to Met2. Upper panel, Normalized expression at the gene level in reads per kilobases of exon per million mapped reads (RPKM). Lower panel, fraction of mutant allele transcripts.
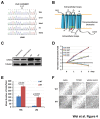
Figure 4. LPAR1 (R163W) mutation does not affect cell growth, but causes increased cell motility.
(A) Sanger sequencing validated the LPAR1 mutation. The mutation was present only in tumors, not in the germ line DNAs. (B) A schematic diagram shows the position of the R163W mutation (*) which was located at the junction of the second intracellular domain and fourth transmembrane domain of LPAR1. (C) A Western blot showed forced expression of human wild-type (WT), R163W mutant (MT), and mouse endogenous LPAR1 receptors in NIH3T3 cells using a rabbit polyclonal antibody from Novus Biologicals (Littleton, CO). (D) NIH3T3 cells expressing mutation (MT) and wild-type of LPAR1 (WT) grew at a similar rate in 0, 1, and 10% new born bovine serum (NBS). Each time point was normalized to day 0, and the average cell growth was plotted. Error bars represent standard deviations. (E) NIH3T3 cells expressing MT LPAR1 showed a significant increased motility compared to those expressing WT LPAR1 in response to serum or LPA gradient in a Boyden chamber assay. Error bars represent standard errors. (F) Scratch assays confirmed the increased motility of NIH3T3 cells expressing MT compared to WT LPAR1. A Rho kinase (ROCK)-specific inhibitor, Y27632, reduced the cell motility mediated by the MT LPAR1 receptor. White scale bars are 200 μm.
Figure 5. LPAR1 (R163W) mutation promotes cell mobility through activation of Rho pathway.
(A) Rho activation assays (upper panel) showed a transient increase of GTP-bound Rho after exposure to LPA ligand (10 μM) in both wild-type (WT) and mutant (MT) LPAR1 expressing NIH3T3 cells indicating activation of Rho pathway mediated by the receptors. Signal of immunobands in the Western blot (upper panel) was quantified, and abundance of the GTP-bound Rho is plotted after normalization against total Rho and β-actin in the lower panel. (B) MT LPAR1 showed heightened signaling through the Rho pathway in transiently transfected COS-7 cells exposed to LPA in a dose-response way (P<0.05) compared to WT. SRE represents the serum response element activity normalized against renilla luciferase and vehicle control. Error bars represent standard errors.
Similar articles
- Exome and deep sequencing of clinically aggressive neuroblastoma reveal somatic mutations that affect key pathways involved in cancer progression.
Lasorsa VA, Formicola D, Pignataro P, Cimmino F, Calabrese FM, Mora J, Esposito MR, Pantile M, Zanon C, De Mariano M, Longo L, Hogarty MD, de Torres C, Tonini GP, Iolascon A, Capasso M. Lasorsa VA, et al. Oncotarget. 2016 Apr 19;7(16):21840-52. doi: 10.18632/oncotarget.8187. Oncotarget. 2016. PMID: 27009842 Free PMC article. - Association of age at diagnosis and genetic mutations in patients with neuroblastoma.
Cheung NK, Zhang J, Lu C, Parker M, Bahrami A, Tickoo SK, Heguy A, Pappo AS, Federico S, Dalton J, Cheung IY, Ding L, Fulton R, Wang J, Chen X, Becksfort J, Wu J, Billups CA, Ellison D, Mardis ER, Wilson RK, Downing JR, Dyer MA; St Jude Children's Research Hospital–Washington University Pediatric Cancer Genome Project. Cheung NK, et al. JAMA. 2012 Mar 14;307(10):1062-71. doi: 10.1001/jama.2012.228. JAMA. 2012. PMID: 22416102 Free PMC article. Clinical Trial. - Enrichment of Targetable Mutations in the Relapsed Neuroblastoma Genome.
Padovan-Merhar OM, Raman P, Ostrovnaya I, Kalletla K, Rubnitz KR, Sanford EM, Ali SM, Miller VA, Mossé YP, Granger MP, Weiss B, Maris JM, Modak S. Padovan-Merhar OM, et al. PLoS Genet. 2016 Dec 20;12(12):e1006501. doi: 10.1371/journal.pgen.1006501. eCollection 2016 Dec. PLoS Genet. 2016. PMID: 27997549 Free PMC article. - Advances in computational approaches for prioritizing driver mutations and significantly mutated genes in cancer genomes.
Cheng F, Zhao J, Zhao Z. Cheng F, et al. Brief Bioinform. 2016 Jul;17(4):642-56. doi: 10.1093/bib/bbv068. Epub 2015 Aug 24. Brief Bioinform. 2016. PMID: 26307061 Free PMC article. Review.
Cited by
- Reduction of LPAR1 Expression in Neuroblastoma Promotes Tumor Cell Migration.
Liu X, Pei M, Yu Y, Wang X, Gui J. Liu X, et al. Cancers (Basel). 2022 Jul 9;14(14):3346. doi: 10.3390/cancers14143346. Cancers (Basel). 2022. PMID: 35884407 Free PMC article. - Eukaryotic ribosome quality control system: a potential therapeutic target for human diseases.
Zhao PY, Yao RQ, Zhang ZC, Zhu SY, Li YX, Ren C, Du XH, Yao YM. Zhao PY, et al. Int J Biol Sci. 2022 Mar 14;18(6):2497-2514. doi: 10.7150/ijbs.70955. eCollection 2022. Int J Biol Sci. 2022. PMID: 35414791 Free PMC article. Review. - Mutational spectrum of ATRX aberrations in neuroblastoma and associated patient and tumor characteristics.
van Gerven MR, Bozsaky E, Matser YAH, Vosseberg J, Taschner-Mandl S, Koster J, Tytgat GAM, Molenaar JJ, van den Boogaard M. van Gerven MR, et al. Cancer Sci. 2022 Jun;113(6):2167-2178. doi: 10.1111/cas.15363. Epub 2022 Apr 26. Cancer Sci. 2022. PMID: 35384159 Free PMC article. - Role of Silymarin in Cancer Treatment: Facts, Hypotheses, and Questions.
Koltai T, Fliegel L. Koltai T, et al. J Evid Based Integr Med. 2022 Jan-Dec;27:2515690X211068826. doi: 10.1177/2515690X211068826. J Evid Based Integr Med. 2022. PMID: 35018864 Free PMC article. Review. - Expression profile of RNA binding protein in cervical cancer using bioinformatics approach.
Huang Z, Li F, Li Q. Huang Z, et al. Cancer Cell Int. 2021 Dec 4;21(1):647. doi: 10.1186/s12935-021-02319-7. Cancer Cell Int. 2021. PMID: 34863153 Free PMC article.
References
- Goodman M, Gurney JG, Smith MA, Olshan AF (1999) Cancer Incidence and Survival Among Children and Adolescents. United States SEER Program; pp. 1975-1995, Sympathetic nervous system tumors. http://seer.cancer.gov/publications/childhood/sympathetic.pdf . Accessed 2013 September 16
Publication types
MeSH terms
Substances
LinkOut - more resources
Full Text Sources
Other Literature Sources
Medical
Miscellaneous


