GATA-1 regulates the generation and function of basophils - PubMed (original) (raw)
GATA-1 regulates the generation and function of basophils
Yuichiro Nei et al. Proc Natl Acad Sci U S A. 2013.
Abstract
Developmental processes of hematopoietic cells are orchestrated by transcriptional networks. GATA-1, the founding member of the GATA family of transcription factors, has been demonstrated to play crucial roles in the differentiation of erythroid cells, magakaryocytes, eosinophils, and mast cells. However, the role of GATA-1 in basophils remains elusive. Here we show that basophils abundantly express Gata1 mRNAs, and that siRNA-mediated knockdown of Gata1 resulted in impaired production of IL-4 by basophils in response to the stimulation with IgE plus antigens. ΔdblGATA mice that carry the mutated Gata1 promoter and are widely used for functional analysis of eosinophils owing to their selective loss of eosinophils showed a decreased number of basophils with reduced expression of Gata1 mRNAs. The number of basophil progenitors in bone marrow was reduced in these mice, and the generation of basophils from their bone marrow cells in culture with IL-3 or thymic stromal lymphopoietin was impaired. ΔdblGATA basophils responded poorly ex vivo to stimulation with IgE plus antigens compared with wild-type basophils as assessed by degranulation and production of IL-4 and IL-6. Moreover, ΔdblGATA mice showed impaired responses in basophil-mediated protective immunity against intestinal helminth infection. Thus, ΔdblGATA mice showed numerical and functional aberrancy in basophils in addition to the known deficiency of eosinophils. Our findings demonstrate that GATA-1 plays a key role in the generation and function of basophils and underscore the need for careful distinction of the cell lineage responsible for each phenotype observed in ΔdblGATA mice.
Conflict of interest statement
The authors declare no conflict of interest.
Figures
Fig. 1.
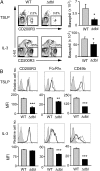
Knockdown of Gata1 in basophils impairs their IL-4 production. (A) Eosinophils, basophils, and neutrophils were separately isolated from the bone marrow of BALB/c mice, and subjected to RT-PCR analysis. The relative expression of Gata1 is shown (mean ± SEM, n = 3 each); the level of expression in eosinophils is set as 1. (B_−_E) _Gata1_-specific or control siRNAs were introduced into IL-3−cultured basophils generated from BALB/c bone marrow cells. Two days later, siRNA-treated basophils were subjected to RT-PCR analysis for Gata1 expression (B, mean ± SEM, n = 3 each), and flow cytometric analysis for indicated surface markers (C). In C, representative staining profiles are shown (Upper); gray, black, and shaded histograms indicate those of control and Gata1 siRNA-treated basophils, and control staining with isotype-matched antibodies, respectively. The mean fluorescence intensity (MFI) of each surface marker is shown (Lower) (mean ± SEM, n = 3 each). In D and E, basophils treated with _Gata1_-specific or control siRNAs were stimulated with TNP-specific IgE plus TNP-OVA or control OVA for 3 h (D) or 6 h (E), and subjected to RT-PCR analysis for Il4 expression (D, mean ± SEM, n = 3 each) or flow cytometric analysis for IL-4 production (E). In E, representative staining profiles are shown (Upper); black and gray histograms indicate those of TNP-OVA and OVA-treated basophils, respectively. The percentage of IL-4–producing cells among basophils is shown (Lower) (mean ± SEM, n = 3 each). Data in A_−_E are representative of at least three independent experiments. **P < 0.01; ***P < 0.001.
Fig. 2.
ΔdblGATA BALB/c mice show basophilopenia with a reduced number of basophil progenitors. (A) Numbers of basophils, defined as FSClowSSClowCD200R3+c-kit− cells, in the bone marrow, peripheral blood, and spleen of wild-type (WT) and ΔdblGATA (Δdbl) BALB/c mice (mean ± SEM, n = 3 each). (B) Basophils isolated from the bone marrow of WT and Δdbl mice were subjected to RT-PCR analysis. The relative expression of Gata1 and Gata2 mRNAs is shown (mean ± SEM, n = 4 each); the level of expression in WT basophils is set as 1. (C) Cell surface phenotype of bone marrow basophils isolated from WT and Δdbl mice. Representative staining profiles are shown (Upper); gray, black, and shaded histograms indicate those of WT and Δdbl basophils and control staining with isotype-matched antibodies, respectively. MFI of each surface marker is shown (Lower) (mean ± SEM, n = 4 each). (D) Numbers of basophil progenitors (BaP) in the bone marrow of WT and Δdbl mice (mean ± SEM, n = 4 each). Data in A_−_D are representative of three independent experiments. *P < 0.05; **P < 0.01; ***P < 0.001.
Fig. 3.
ΔdblGATA bone marrow cells show impaired generation of basophils when cultured ex vivo with TSLP or IL-3. Bone marrow cells isolated from WT or Δdbl BALB/c mice were cultured ex vivo with TSLP or IL-3 for 5 d. (A) Basophils were identified as FSClowSSClowCD200R3+c-kit− cells as shown at Left, and the number of basophils in each group is summarized at Right (mean ± SEM, n = 4 each). (B) The cell surface phenotype of bone marrow-derived basophils. Representative staining profiles are shown (TSLP and IL-3 rows); gray, black, and shaded histograms indicate those of WT and Δdbl basophils and control staining with isotype-matched antibodies, respectively. MFI of each surface marker is shown (MFI rows) (mean ± SEM, n = 4 each). Data shown are representative of at least two independent experiments. *P < 0.05; **P < 0.01; ***P < 0.001.
Fig. 4.
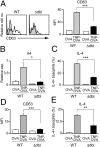
ΔdblGATA basophils show defects in degranulation and cytokine production. (A −C) IL-3−elicited WT or Δdbl basophils were stimulated with anti-TNP IgE plus TNP-OVA or control OVA for 20 min (A), 3 h (B), or 6 h (C), and subjected to flow cytometric analysis for surface CD63 expression (A), RT-PCR analysis for Il4 expression (B), or flow cytometric analysis for IL-4 production (C). In A, open and shaded histograms indicate CD63 expression when stimulated with TNP-OVA and control OVA, respectively. (D and E) Primary basophils isolated from the bone marrow and spleen of WT or Δdbl mice were stimulated with anti-TNP IgE plus TNP-OVA or control OVA for 20 min (D) or 6 h (E), and subjected to flow cytometric analysis for surface CD63 expression (D) or flow cytometric analysis for IL-4 production (E). Data shown are the mean ± SEM (n = 3 or 4 each), and representative of three independent experiments, and displayed as in Fig. 1. *P < 0.05; **P < 0.01; ***P < 0.001.
Fig. 5.
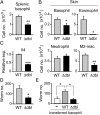
ΔdblGATA mice show impaired acquired protection against intestinal helminths due to basophil anomaly. (A_−_D) WT and Δdbl BALB/c mice were infected twice with N. brasiliensis larvae, and on day 2 of the second infection, their spleen and skin of larva inoculation site were isolated, and subjected to numerical counts of basophils in the spleen (A), indicated cell types accumulating in the skin (B, Upper and Lower), and skin-trapped worms (D). M2-Mac, M2-type macrophage. In C, basophils were sorted from the skin preparation and subjected to RT-PCR analysis for Il4 expression. (E) WT and Δdbl mice were infected once with N. brasiliensis larvae, and basophils were sorted from their bone marrow cells on day 18 of infection. These _N. brasiliensis_-sensitized basophils isolated from WT or Δdbl mice were intraperitoneally transferred into Δdbl mice (4 × 10⁴ cells per mouse) that had been infected with larvae 18 d before. On the day of cell transfer, the recipient mice were subjected to the second infection, and 2 d later, the skin of the larva inoculation site was isolated, and subjected to a numerical count of larvae. In parallel, twice-infected Δdbl mice without basophil transfer (−) were analyzed as control. Data shown are the mean ± SEM (n = 3 or 4 each), and representative of three independent experiments. *P < 0.05; **P < 0.01; ***P < 0.001.
Similar articles
- GATA1 controls numbers of hematopoietic progenitors and their response to autoimmune neuroinflammation.
Hwang D, Ishikawa LLW, Seyedsadr MS, Mari E, Kasimoglu E, Sahin Z, Boehm A, Jang S, Rasouli J, Vaccaro C, Gonzalez M, Hakonarson H, Rostami A, Zhang GX, Ciric B. Hwang D, et al. Blood Adv. 2022 Dec 13;6(23):5980-5994. doi: 10.1182/bloodadvances.2022008234. Blood Adv. 2022. PMID: 36206195 Free PMC article. - Eosinophils from lineage-ablated Delta dblGATA bone marrow progenitors: the dblGATA enhancer in the promoter of GATA-1 is not essential for differentiation ex vivo.
Dyer KD, Czapiga M, Foster B, Foster PS, Kang EM, Lappas CM, Moser JM, Naumann N, Percopo CM, Siegel SJ, Swartz JM, Ting-De Ravin S, Rosenberg HF. Dyer KD, et al. J Immunol. 2007 Aug 1;179(3):1693-9. doi: 10.4049/jimmunol.179.3.1693. J Immunol. 2007. PMID: 17641035 - A regulatory network governing Gata1 and Gata2 gene transcription orchestrates erythroid lineage differentiation.
Moriguchi T, Yamamoto M. Moriguchi T, et al. Int J Hematol. 2014 Nov;100(5):417-24. doi: 10.1007/s12185-014-1568-0. Epub 2014 Mar 18. Int J Hematol. 2014. PMID: 24638828 Review. - GATA switches as developmental drivers.
Bresnick EH, Lee HY, Fujiwara T, Johnson KD, Keles S. Bresnick EH, et al. J Biol Chem. 2010 Oct 8;285(41):31087-93. doi: 10.1074/jbc.R110.159079. Epub 2010 Jul 29. J Biol Chem. 2010. PMID: 20670937 Free PMC article. Review.
Cited by
- GATA1 controls numbers of hematopoietic progenitors and their response to autoimmune neuroinflammation.
Hwang D, Ishikawa LLW, Seyedsadr MS, Mari E, Kasimoglu E, Sahin Z, Boehm A, Jang S, Rasouli J, Vaccaro C, Gonzalez M, Hakonarson H, Rostami A, Zhang GX, Ciric B. Hwang D, et al. Blood Adv. 2022 Dec 13;6(23):5980-5994. doi: 10.1182/bloodadvances.2022008234. Blood Adv. 2022. PMID: 36206195 Free PMC article. - Transcription factors in megakaryocytes and platelets.
Yuan H, Liu Y, Zhang J, Dong JF, Zhao Z. Yuan H, et al. Front Immunol. 2023 Mar 9;14:1140501. doi: 10.3389/fimmu.2023.1140501. eCollection 2023. Front Immunol. 2023. PMID: 36969155 Free PMC article. Review. - Eosinophils Decrease Pulmonary Metastatic Mammary Tumor Growth.
Cederberg RA, Franks SE, Wadsworth BJ, So A, Decotret LR, Hall MG, Shi R, Hughes MR, McNagny KM, Bennewith KL. Cederberg RA, et al. Front Oncol. 2022 Jun 8;12:841921. doi: 10.3389/fonc.2022.841921. eCollection 2022. Front Oncol. 2022. PMID: 35756626 Free PMC article. - GATA1 deletion in human pluripotent stem cells increases differentiation yield and maturity of neutrophils.
Harper TC, Oberlick EM, Smith TJ, Nunes DE, Bray MA, Park S, Driscoll CD, Mowbray SF, Antczak C. Harper TC, et al. iScience. 2023 Aug 31;26(10):107804. doi: 10.1016/j.isci.2023.107804. eCollection 2023 Oct 20. iScience. 2023. PMID: 37720099 Free PMC article. - Immunogenomics reveal molecular circuits of diclofenac induced liver injury in mice.
Lee EH, Oh JH, Selvaraj S, Park SM, Choi MS, Spanel R, Yoon S, Borlak J. Lee EH, et al. Oncotarget. 2016 Mar 22;7(12):14983-5017. doi: 10.18632/oncotarget.7698. Oncotarget. 2016. PMID: 26934552 Free PMC article.
References
- Yamamoto M, et al. Activity and tissue-specific expression of the transcription factor NF-E1 multigene family. Genes Dev. 1990;4(10):1650–1662. - PubMed
- Orkin SH. GATA-binding transcription factors in hematopoietic cells. Blood. 1992;80(3):575–581. - PubMed
- Romeo PH, et al. Megakaryocytic and erythrocytic lineages share specific transcription factors. Nature. 1990;344(6265):447–449. - PubMed
Publication types
MeSH terms
Substances
LinkOut - more resources
Full Text Sources
Other Literature Sources
Medical
Molecular Biology Databases


