Persistent telomere cohesion triggers a prolonged anaphase - PubMed (original) (raw)
Persistent telomere cohesion triggers a prolonged anaphase
Mi Kyung Kim et al. Mol Biol Cell. 2014 Jan.
Abstract
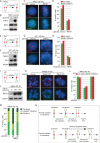
Telomeres use distinct mechanisms (not used by arms or centromeres) to mediate cohesion between sister chromatids. However, the motivation for a specialized mechanism at telomeres is not well understood. Here we show, using fluorescence in situ hybridization and live-cell imaging, that persistent sister chromatid cohesion at telomeres triggers a prolonged anaphase in normal human cells and cancer cells. Excess cohesion at telomeres can be induced by inhibition of tankyrase 1, a poly(ADP-ribose) polymerase that is required for resolution of telomere cohesion, or by overexpression of proteins required to establish telomere cohesion, the shelterin subunit TIN2 and the cohesin subunit SA1. Regardless of the method of induction, excess cohesion at telomeres in mitosis prevents a robust and efficient anaphase. SA1- or TIN2-induced excess cohesion and anaphase delay can be rescued by overexpression of tankyrase 1. Moreover, we show that primary fibroblasts, which accumulate excess telomere cohesion at mitosis naturally during replicative aging, undergo a similar delay in anaphase progression that can also be rescued by overexpression of tankyrase 1. Our study demonstrates that there are opposing forces that regulate telomere cohesion. The observation that cells respond to unresolved telomere cohesion by delaying (but not completely disrupting) anaphase progression suggests a mechanism for tolerating excess cohesion and maintaining telomere integrity. This attempt to deal with telomere damage may be ultimately futile for aging fibroblasts but useful for cancer cells.
Figures
FIGURE 1:
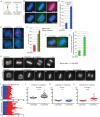
Tankyrase 1 inhibition by the small-molecule inhibitor XAV939 leads to prolonged anaphase. (A) Schematic diagram depicting persistent telomere cohesion and loss of centromere cohesion induced by XAV939 treatment. (B, C) Anaphase figures are increased in XAV939-treated cells. HeLaI.2.11 cells were synchronized with a double-thymidine block, released into S phase in the presence or absence of XAV939 for 10 h, fixed on coverslips in methanol, and (B) analyzed by immunofluorescence with anti-ACA (green) and cyclin B (red) antibodies. DNA was stained with DAPI (blue). Scale bar, 5 μm. (C) Graphical representation of the percentage of mitotic cells with centromeres separated. Values are means ± SD, derived from three independent experiments (n = 19–30 mitotic cells each of 200–212 total cells each). Student's t test was used to calculate the p value (****p ≤ 0.0001). (D, E). XAV939 induces loss of centromere cohesion with persistent telomere cohesion. HeLaI.2.11 cells were synchronized with a double-thymidine block, released into S phase in the presence or absence of XAV939 for 10 h, isolated by mitotic shake-off, and analyzed by (D) centromere (red) and telomere (green) FISH. DNA was stained with DAPI (blue). Scale bar, 5 μm. (E) Graphical representation of the frequency of mitotic cells with centromeres apart and telomeres cohered (n = 50–60 cells each). (F, G) Telomere separation is delayed in cells that have separated centromeres. (F) Cells were treated and processed as in D, but telomere cohesion was scored only in cells that had separated centromeres. (G) Graphical representation of the frequency of mitotic cells with centromeres separated that show cohered telomeres. Values are means ± SEM, derived from two independent experiments (n = 100 cells each). (H–L) Live-cell imaging indicates that XAV939 induces anaphase delay. (H) Time-lapse video live-cell imaging of HeLa-H2B-GFP cells synchronized by a double-thymidine block, released in the presence or absence of XAV939 for 7 h, and imaged for 6 h. Progression from prophase to anaphase for individual cells. Scale bar, 5 μm. (I– L) Graphical summaries of individual mitotic cells (n = 23–37 cells each) shown as (I) a time line and (J–L) scatterplots with calculated mean value ± SEM. Student's t test was used to calculate p values (ns, p ≥ 0.05; ****p ≤ 0.0001).
FIGURE 2:
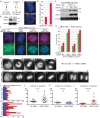
Tankyrase 1 depletion by siRNA leads to anaphase delay in HTC75 cells. **(**A–D) Centromeres separate in tankyrase 1–depleted cells. (A) Schematic diagram depicting persistent telomere cohesion and loss of centromere cohesion induced by TNKS1 depletion. (B–D) HTC75 cells treated with GFP or TNKS1 siRNA for 48 h were analyzed by (B) immunoblot and (C) centromere FISH (red) after mitotic shake-off. (D) Graphical representation of the frequency of mitotic cells with centromeres apart. Values are means ± SEM derived from two independent experiments (n = 30–100 cells each). (E–G) Wild-type (WT) but not PARP-dead tankyrase 1 rescues centromere separation. Stable HTC75 cell lines expressing GFP or TNKS1 shRNA were transfected with a vector control or siRNA resistant (r) TNKS1 WT or PARP-dead plasmids and analyzed by (E) immunoblot and (F) centromere (red) and telomere (green) FISH after mitotic shake-off. (G) Graphical representation of the frequency of mitotic cells with telomeres cohered and centromeres apart. Values are means ± SEM, derived from two independent experiments (n = 50–146 cells each). (C, F) DNA was stained with DAPI (blue). Scale bars, 5 μm. (H–L) Time-lapse video live-cell imaging of a HTC75-H2B-GFP cell line 36 h after transfection with GFP or TNKS1 siRNA. (H) Progression from prophase to anaphase for individual cells. Scale bar, 5 μm. (I–L) Graphical summaries of individual mitotic cells (n = 20–21 cells from two independent experiments) shown as (I) a time line and (J–L) scatterplots with calculated mean value ± SEM. Student's t test was used to calculate p values (ns, p ≥ 0.05; **p ≤ 0.01; ***p ≤ 0.001).
FIGURE 3:
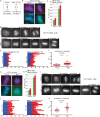
TIN2C or SA1 overexpression leads to anaphase delay. (A) Schematic diagram depicting persistent telomere cohesion and loss of centromere cohesion induced by TIN2C or SA1 overexpression. (B, C, G, H) TIN2C and SA1 overexpression leads to a loss in centromere cohesion. HTC75 cells stably expressing (B, C) V or TIN2C or (G, H) V or SA1 were analyzed by (B, G) centromere (red) and telomere (green) FISH after mitotic shake-off. DNA was stained with DAPI (blue). Scale bars, 5 μm. (C, H) Graphical representation of the frequency of mitotic cells with centromeres apart and telomeres cohered. Values are means ± SEM, derived from two independent experiments (C, n = 50–56 cells each; H, n = 50–60 cells each). (D–F, I–K) Live-cell imaging indicates that TIN2C or SA1 overexpression induces anaphase delay. Time-lapse video live-cell imaging of (D–F) HTC75.Vector-H2B-GFP and HTC75.TIN2C-H2B-GFP or (I–K) HTC75.Vector-H2B-GFP and HTC75.SA1-H2B-GFP cell lines. (D, I) Progression from prophase to anaphase for individual cells. Scale bars, 5 μm. (E, F, J, K) Graphical summaries of individual mitotic cells (E, F; n = 49–56 cells each from two independent experiments) and (I–K; n = 18–21 cells each) shown as (E, J) a time line and (F, K) a scatterplot with calculated mean value ± SEM. Student's t test was used to calculate p values (***p ≤ 0.001; ****p ≤ 0.0001).
FIGURE 4:
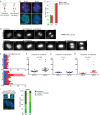
Replicative aging leads to anaphase delay. (A–C) Centromeres separate concomitant with persistent telomere cohesion in aging IMR90 cells. (A) Schematic diagram depicting persistent telomere cohesion and loss of centromere cohesion young vs. old cells. (B, C). IMR90 cells from PD 20 and 52 analyzed by (B) centromere (red) and telomere (green) FISH after mitotic shake-off. DNA was stained with DAPI (blue). Scale bar, 5 μm. (C) Graphical representation of the frequency of mitotic cells with centromeres apart and telomeres cohered. Values are means ± SEM, derived from two independent experiments (n = 45–50 cells each). (D–H) Time-lapse video live-cell imaging of IMR90-H2B-GFP cell line at PD 23 and 52. (D) Progression from prophase to anaphase for individual cells. Scale bar, 5 μm. (E–H) Graphical summaries of individual mitotic cells (n = 17–18 cells) shown as (E) a time line and (F–H) scatter plots with calculated mean value ± SEM. Student's t test was used to calculate p values (ns, p ≥ 0.05; **p ≤ 0.01). (I, J) Aging cells show loss of synchrony in sister telomere separation. (I) Aging IMR90 cells analyzed by telomere (green) FISH after mitotic shake-off exhibit one singlet/one doublet. DNA was stained with DAPI (blue). Scale bars, 5 μm. (J) Graphical representation of the frequency of mitotic cells with one singlet/one doublet, two singlets, or two doublets in IMR90 cells at PD 20 or 52. Values are means ± SEM, derived from two independent experiments (n = 50 cells each).
FIGURE 5:
Tankyrase 1 overexpression rescues persistent telomere cohesion, regardless of the mechanism of induction. (A–H) Tankyrase 1 overexpression rescues persistent telomere cohesion and loss of centromere cohesion in TIN2C- or SA1-overexpressing cells. (A, E) Schematic diagrams. (B–D) HTC75.V or TIN2C and (F–H) HTC75.V or SA1 cells were transfected for 24 h with a vector or TNKS1 plasmid and analyzed by (B, F) immunoblot and (C, G) centromere (red) and telomere (green) FISH after mitotic shake-off. DNA was stained with DAPI (blue). Scale bars, 5 μm. (D, H) Graphical representation of the frequency of mitotic cells with centromeres apart and telomeres cohered (D, n = 50–56 cells each; H, n = 50–60 cells each). (I–L) Wild-type but not PARP-dead tankyrase 1 rescues telomere cohesion and centromere separation in aging IMR90 cells. (I) Schematic diagram. (J–L) IMR90 cells stably expressing tankyrase 1 WT or PARP dead or a vector control were generated by lentiviral infection at an early PD (20). Cell lines were grown for multiple PDs and then, before senescence (PD 48), analyzed by (J) immunoblot and (K) centromere (red) and telomere (green) FISH after mitotic shake-off. DNA was stained with DAPI (blue). Scale bar, 5 μm. (L) Graphical representation of the frequency of mitotic cells with telomeres cohered and centromeres apart. Values are means ± SEM, derived from two independent experiments (n = 50 cells each). (M) Loss of synchrony in sister telomere separation in aging IMR90 cells can be rescued by wild-type but not PARP-dead tankyrase 1. Graphical representation of the frequency of mitotic cells with one singlet/one doublet, two singlets, or two doublets in IMR90 cells expressing vector, TNKS1.WT, or TNKS1.PARP dead at PD 48. Values are means ± SEM, derived from two independent experiments (n = 50 cells each). (N) Model showing that excess telomere cohesion leads to anaphase delay.
Similar articles
- Resolution of sister telomere association is required for progression through mitosis.
Dynek JN, Smith S. Dynek JN, et al. Science. 2004 Apr 2;304(5667):97-100. doi: 10.1126/science.1094754. Science. 2004. PMID: 15064417 - Protein requirements for sister telomere association in human cells.
Canudas S, Houghtaling BR, Kim JY, Dynek JN, Chang WG, Smith S. Canudas S, et al. EMBO J. 2007 Nov 28;26(23):4867-78. doi: 10.1038/sj.emboj.7601903. Epub 2007 Oct 25. EMBO J. 2007. PMID: 17962804 Free PMC article. - SA1 binds directly to DNA through its unique AT-hook to promote sister chromatid cohesion at telomeres.
Bisht KK, Daniloski Z, Smith S. Bisht KK, et al. J Cell Sci. 2013 Aug 1;126(Pt 15):3493-503. doi: 10.1242/jcs.130872. Epub 2013 May 31. J Cell Sci. 2013. PMID: 23729739 Free PMC article. - Tankyrase function at telomeres, spindle poles, and beyond.
Hsiao SJ, Smith S. Hsiao SJ, et al. Biochimie. 2008 Jan;90(1):83-92. doi: 10.1016/j.biochi.2007.07.012. Epub 2007 Jul 24. Biochimie. 2008. PMID: 17825467 Review. - Sister chromatid cohesion along arms and at centromeres.
Watanabe Y. Watanabe Y. Trends Genet. 2005 Jul;21(7):405-12. doi: 10.1016/j.tig.2005.05.009. Trends Genet. 2005. PMID: 15946764 Review.
Cited by
- High-throughput screen to identify compounds that prevent or target telomere loss in human cancer cells.
Wilson C, Murnane JP. Wilson C, et al. NAR Cancer. 2022 Oct 3;4(4):zcac029. doi: 10.1093/narcan/zcac029. eCollection 2022 Dec. NAR Cancer. 2022. PMID: 36196242 Free PMC article. - A primary melanoma and its asynchronous metastasis highlight the role of BRAF, CDKN2A, and TERT.
Hosler GA, Davoli T, Mender I, Litzner B, Choi J, Kapur P, Shay JW, Wang RC. Hosler GA, et al. J Cutan Pathol. 2015 Feb;42(2):108-17. doi: 10.1111/cup.12444. Epub 2014 Dec 11. J Cutan Pathol. 2015. PMID: 25407517 Free PMC article. - Poly(ADP-ribose) polymerase enzymes and the maintenance of genome integrity.
Eisemann T, Pascal JM. Eisemann T, et al. Cell Mol Life Sci. 2020 Jan;77(1):19-33. doi: 10.1007/s00018-019-03366-0. Epub 2019 Nov 21. Cell Mol Life Sci. 2020. PMID: 31754726 Free PMC article. Review. - Tankyrases: structure, function and therapeutic implications in cancer.
Haikarainen T, Krauss S, Lehtio L. Haikarainen T, et al. Curr Pharm Des. 2014;20(41):6472-88. doi: 10.2174/1381612820666140630101525. Curr Pharm Des. 2014. PMID: 24975604 Free PMC article. Review. - Whole proteome analysis of human tankyrase knockout cells reveals targets of tankyrase-mediated degradation.
Bhardwaj A, Yang Y, Ueberheide B, Smith S. Bhardwaj A, et al. Nat Commun. 2017 Dec 20;8(1):2214. doi: 10.1038/s41467-017-02363-w. Nat Commun. 2017. PMID: 29263426 Free PMC article.
References
Publication types
MeSH terms
Substances
LinkOut - more resources
Full Text Sources
Other Literature Sources
Research Materials
