Angiogenic capacity of M1- and M2-polarized macrophages is determined by the levels of TIMP-1 complexed with their secreted proMMP-9 - PubMed (original) (raw)
Clinical Trial
Angiogenic capacity of M1- and M2-polarized macrophages is determined by the levels of TIMP-1 complexed with their secreted proMMP-9
Ewa Zajac et al. Blood. 2013.
Abstract
A proangiogenic function of tissue-infiltrating monocytes/macrophages has long been attributed to their matrix metalloproteinase-9 zymogen (proMMP-9). Herein, we evaluated the capacity of human monocytes, mature M0 macrophages, and M1- and M2-polarized macrophages to induce proMMP-9-mediated angiogenesis. Only M2 macrophages induced angiogenesis at levels comparable with highly angiogenic neutrophils previously shown to release their proMMP-9 in a unique form, free of tissue inhibitor of metalloproteinases-1 (TIMP-1). Macrophage differentiation was accompanied by induction of low-angiogenic, TIMP-1-encumbered proMMP-9. However, polarization toward the M2, but not the M1 phenotype, caused a substantial downregulation of TIMP-1 expression, resulting in production of angiogenic, TIMP-deficient proMMP-9. Correspondingly, the angiogenic potency of M2 proMMP-9 was lost after its complexing with TIMP-1, whereas TIMP-1 silencing in M0/M1 macrophages rendered them both angiogenic. Similar to human cells, murine bone marrow-derived M2 macrophages also shut down their TIMP-1 expression and produced proMMP-9 unencumbered by TIMP-1. Providing proof that angiogenic capacity of murine M2 macrophages depended on their TIMP-free proMMP-9, Mmp9-null M2 macrophages were nonangiogenic, although their TIMP-1 was severely downregulated. Our study provides a unifying molecular mechanism for high angiogenic capacity of TIMP-free proMMP-9 that would be uniquely produced in a pathophysiological microenvironment by influxing neutrophils and/or M2 polarized macrophages.
Figures
Figure 1
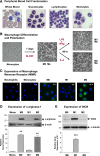
Maturation and polarization of human macrophages and expression of characteristic M1 and M2 markers. (A) Isolation of distinct cell populations from peripheral blood. Granulocytes, monocytes, and lymphocytes were fractionated from peripheral blood of healthy donors. Smears of whole blood and isolated cells were stained to analyze the purity of distinct cell populations. The representative images of stained cells demonstrate high purity fractions of neutrophils (97-99% of granulocytic fraction), lymphocytes (96-99%), and monocytes (92-98%). Images were acquired using an Olympus BX60 microscope (Olympus America, Melville, NY), equipped with a digital DVC video camera and high-performance ImageJ plugin acquisition software (DVC Company, Austin, TX), and processed using Adobe Photoshop. Objective lens, ×40. (B) Maturation and polarization of macrophages. Purified monocytes were incubated for 7 days with M-CSF to differentiate into mature macrophages (M0 phenotype). The M0 macrophages were then polarized for additional 2 days into M1 macrophages by substituting M-CSF for a mixture of LPS and IFNγ and into M2 macrophages by stimulation with IL-4. Note the changes in morphology of rounded, loosely adherent monocytes to elongated, firmly adherent M0 macrophages, which retained their M0 morphology being polarized into M1 macrophages and become more rounded and less adhesive after M2 polarization. Phase contrast images were acquired using an Olympus CKX-41 microscope equipped with Olympus U-LS30-3 video camera (Olympus America, Center Valley, PA) and Infinity Capture software (Lumenera, Ottawa, Canada), and processed using Adobe Photoshop. Objective lens, 20×. (C) Analysis of MMR expression. Immunocytochemical staining was performed for MMR (CD206) on permeabilized cells to visualize both cell surface and intracellular pools of the protein. The staining indicates that MMR (green) is not detectable in freshly isolated neutrophils and monocytes. MMR expression is moderately induced during differentiation of monocytes into M0 macrophages but is inhibited during polarization into M1 macrophages. In contrast, M2 polarization is accompanied by substantial increase in the levels of MMR expression. Cell nuclei were stained with 4,6 diamidino-2-phenylindole (blue). Images were acquired using a Carl Zeiss AxioImager M1m microscope equipped with AxioVision Re.4.6 software (Carl Zeiss Microscopy, Thornwood, NY) and processed using Adobe Photoshop. Objective lens, ×40. Inserted numerical data represent the levels of cell surface expression of MMR as determined by flow cytometry. Indicated is mean fluorescence intensity determined after subtraction of nonspecific values for mouse IgG. (D) Analysis of α-arginase-1 expression. (Upper) Western blot analysis for α-arginase-1 was conducted on cell lysates separated by sodium dodecyl sulfate-polyacrylamide gel electrophoresis (SDS-PAGE) under reducing conditions (40 µg protein per lane). The 38-kDa α-arginase-1 is detectable in M0 and M2 macrophages. (Lower) The blot was reprobed for β-actin (42 kDa) to provide a loading control. Position of molecular weight markers in kilodaltons is indicated on the left. Bar graph, analysis of ARG1 gene expression. Quantitative analysis of ARG1 was performed on mRNA preparations isolated from monocytes and macrophages in comparison with the corresponding levels of housekeeping genes GAPDH and ACTB. Gene expression levels were determined relative to monocytes (1.0). Both protein and gene expression analyses indicate that α-arginase-1 expression is induced during maturation of macrophages from arginase-negative monocytes and is dramatically inhibited during M0 macrophage polarization into the M1, but not M2, phenotype. (E) Analysis of iNOS expression. (Upper) Cell lysates from mature and polarized macrophages (20 µg per lane) were analyzed for iNOS by western blotting under reducing conditions, confirming the induction of 130-kDa iNOS in M2 macrophages. (Lower) The blot was reprobed for α-tubulin (Biolegend) to provide equal loading control. Position of molecular weight markers in kilodaltons is indicated on the left. Bar graph, analysis of NOS2 gene expression. Quantitative analysis of NOS2 was performed on mRNA preparations isolated from macrophages in comparison with the corresponding levels of β-actin. Gene expression levels were determined relative to M0 macrophages (1.0). Both protein and gene expression analyses indicate that iNOS expression is induced during polarization of M0 macrophages toward the M1, but not M2, phenotype.
Figure 2
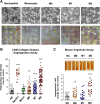
Comparative analysis of angiogenic capabilities of human neutrophils, monocytes, and mature and polarized macrophages. (A) Angiogenic potential of intact leukocytes in the in vivo CAM angiogenesis model. (Upper) Freshly purified neutrophils and monocytes, and macrophages of M0, M1, and M2 phenotypes were incorporated into 2-tier gridded 3D collagen onplants (3 × 10⁴cells/onplant), which were grafted on the CAM of chick embryos. Images were acquired using an Olympus CKX-41 microscope equipped with Olympus U-LS30-3 video camera and Infinity Capture software and processed using Adobe Photoshop. Objective lens, ×20. (Lower) After 76 hours of incubation, the onplants were scored for the presence of newly developed angiogenic vessels distinctly localized above the plane of the lower mesh grids (yellow arrowheads). Images were acquired using an Olympus binocular microscope SZ-PT (Olympus America, Melville, NY) equipped with a DVC video camera and high-performance ImageJ plugin acquisition software. Objective lens, 10×. (B) Angiogenesis-inducing capability of intact cells. The levels of angiogenesis were quantified for individual onplants as a ratio of grids containing new blood vessels to total number of scored grids, providing an angiogenic index. From 4 to 6 embryos, each grafted with 6 collagen onplants, were analyzed in 3 independent experiments. Scattergram presents fold changes in the levels of angiogenesis compared with negative no-cell (NC) control (1.0). Lines represent means of fold changes in angiogenic indices. **P < .01; ***P < .0001. (C) Comparative analysis of mature and polarized macrophages in the mouse angiotube model. Intact viable M0, M1, and M2 macrophages were incorporated into 2.5 mg/mL native collagen at 2 × 10⁶ cells/mL. Phosphate-buffered saline (PBS) was used as a negative, no-cell control (NC). Collagen mixtures were polymerized in the ∼1-cm-long tubes (angiotubes), which were surgically implanted under the skin of immunodeficient mice. The angiotubes were excised from the mice 12 to 14 days after implantation (images on the top). The contents of angiotubes were lysed in equal volumes of lysing buffer and hemoglobin concentration was determined, providing measurements of angiogenesis-inducing capacity of tested cells. Scattergram presents fold changes in the levels of angiogenesis induced by different macrophage types compared with negative NC control (1.0). Lines represent means of fold changes. Shown is a representative experiment from 2 independent experiments, each using from 4 to 5 mice, each implanted with 4 angiotubes. **P < .01; ***P < .0001, between the means from the experimental groups vs NC control.
Figure 3
Induction of proMMP-9 during maturation and polarization of human macrophages. (A) Morphological changes during monocytes differentiation into macrophages. Freshly isolated monocytes were incubated in the presence of M-CSF for 7 days. Note a gradual change in the morphology from rounded monocytes to elongated cells, first noticeable on day 3 and representing almost all M0 macrophages by day 7. Images were acquired using an Olympus CKX-41 microscope equipped with Olympus U-LS30-3 video camera and Infinity Capture software and processed using Adobe Photoshop. Objective lens, ×20. (B) Kinetic analysis of proMMP-9 production during macrophage maturation and polarization. (Left) Gelatin zymography was conducted on serum-free (SF) medium conditioned by 2 × 10⁴ human monocytes cultured in the presence of M-CSF for 7 days and then polarized into M1- or M2 macrophages. The position of 92-kDa proMMP-9 monomer and ∼200-kDa homodimer is indicated on the right. Human recombinant proMMP-9 was loaded to provide the means of quantification of proMMP-9 production. (Right) Zymographic analysis of granule contents released by 1 × 10⁴ neutrophils. The position of 92-kDa proMMP-9 monomer, 125-kDa NGAL heterodimer, and ∼200-kDa homodimer is indicated on the right. Human recombinant proMMP-9 (3 ng per lane) was run to estimate the MMP-9 load in neutrophils. (C) Immunofluorescent analysis of MMP-9 expression in isolated neutrophils and monocytes and mature and polarized macrophages. Macrophages were differentiated from monocytes cultured on coverslips, whereas purified neutrophils and monocytes were directly placed on coverslips after cell isolation. The cells were fixed and then stained for human MMP-9 with mAb 8-3H (green). Cell nuclei were contrasted with 4′6 diamidino-2-phenylindole (blue). Images were acquired using a Carl Zeiss AxioImager M1m microscope equipped with AxioVision Re.4.6 software and processed using Adobe Photoshop. Objective lens, ×40.
Figure 4
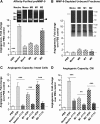
The secreted proMMP-9 and its activation determine angiogenesis-inducing capacity of human monocytes and macrophages. (A) Comparative analysis of angiogenesis-inducing capacity of purified proMMP-9 produced by different cell types. ProMMP-9 released by neutrophils or secreted into SF medium by monocytes or macrophages was purified by affinity chromatography and incorporated into collagen mixture to provide 3 ng proMMP-9 per onplant. Control onplants contained PBS only. (Upper) Zymographic images above the corresponding bars in the graph below indicate equal supplementation of proMMP-9 into the onplants. Triangles indicate positions of the monomer, heterodimer and homodimer of proMMP-9 released by neutrophils (left) and the proMMP-9 monomer secreted by monocytes and macrophages (right). Bar graph, levels of angiogenesis were determined as described in Figure 2B. From 4 to 6 embryos, each grafted with 6 collagen onplants, were analyzed per variable in 3 independent experiments. The pooled data are shown as fold changes (means ± SEM) in the levels of angiogenesis induced by proMMP-9 produced by different cell types compared with PBS control (1.0). Note that, although all tested purified proMMP-9 induced angiogenesis at levels significantly higher than the levels observed in PBS control, equal amounts of proMMP-9 produced by distinct cell types induce different levels of angiogenesis (***P < .0001). (B) The angiogenesis-inducing capacity of the secretate produced by monocytes and macrophages is contained in proMMP-9. (Upper) The flow-through fractions depleted of proMMP-9 by affinity chromatography (compare zymographic images in B and A), but containing >95% of initial protein content (insets from silver-stained gels positioned below zymographic images), were incorporated into collagen onplants at amounts equalized as to being produced by the same number of cells (1.5 × 10⁴/onplant). Open triangle in the zymograph indicates the position where proMMP-9 band would be localized before depletion. Bar graph, levels of angiogenesis were determined 3 days later as described in Figure 2B. The data are from a representative experiment using from 4 to 6 embryos per variant. Bars are means ± SEM of fold-changes in the levels of angiogenesis induced by cell secretates depleted of proMMP-9 compared with PBS control (1.0). (C) Activation of proMMP-9 produced by intact cells is required for induction of angiogenesis. Intact neutrophils and M1 or M2 macrophages were incorporated into collagen onplants (1.5 × 10⁴ cells/onplant), along with 2 µg/mL of either mAb 8-3H, which binds to proMMP-9, but does not block the activation of the proenzyme, or mAb 7-11C, which effectively blocks activation of proMMP-9 into the proteolytically capable MMP-9 enzyme. Control onplants contained PBS only. The levels of angiogenesis were determined as described in Figure 2B. For each variant, from 4 to 6 embryos grafted with 6 collagen onplants were analyzed in 2 independent experiments. The pooled data are shown as fold changes in the levels of angiogenesis induced by different cell types compared with PBS control (1.0). Bars are means ± SEM of fold changes in angiogenic indices. ***P < .0001. (D) Activation of proMMP-9 secreted by macrophages is required for induction of angiogenesis. Neutrophil releasate and SF CM from M1 or M2 macrophages was incorporated into collagen onplants at 1.5 ng of proMMP-9 per onplant along with 2 µg/mL of MMP-9–specific mAbs, namely control mAb 8-3H or activation-blocking mAb 7-11C. Control onplants contained PBS only. The levels of angiogenesis were determined as described in Figure 2B. The data are from a representative experiment using from 4 to 6 embryos per variant. Bars are means ± SEM of fold changes in the levels of angiogenesis induced by CM from different cell types compared with PBS control (1.0). **P < .005; ***P < .0001.
Figure 5
M2 polarization of human macrophages downregulates TIMP-1 expression, resulting in production of highly angiogenic TIMP-1–deficient proMMP-9. (A) (Upper) Production of proMMP-9 and TIMP-1 by monocytes and mature and polarized macrophages. Neutrophil releasate from 5 × 10³ cells and SF medium conditioned by 2 × 10⁴ monocytic cells was analyzed for MMP-9 and TIMP-1 by western blotting under nonreducing conditions. Following transfer, the membrane was cut into 2 portions, which were probed for MMP-9 (top) and TIMP-1 (bottom). Human recombinant proMMP-9 and TIMP-1 were run at the indicated amounts to provide means for quantification of protein production. Positions of the 92-kDa monomer, 125-kDa heterodimer, and ∼200-kDa homodimer of proMMP-9 and 28-kDa TIMP-1 are indicated on the left. Position of molecular weight markers in kilodaltons is indicated on the right. Bar graph, comparative analysis of angiogenesis-inducing capacity of monocytic cell-conditioned media. SF CM from monocytic cells and neutrophil releasate was incorporated at volumes providing equal amounts of proMMP-9 (3 ng per collagen onplant). From 4 to 6 embryos, each grafted with 6 collagen onplants, were analyzed per variable in 5 independent experiments. Bar graph presents means ± SEM of fold changes in the levels of angiogenesis compared with no-cell control (NC, 1.0). **P < .01; ***P < .0001. (B) (Upper) Analysis of the levels of TIMP-1 naturally complexed with proMMP-9 produced by monocytes and mature and polarized macrophages. ProMMP-9 was purified by affinity chromatography from neutrophil releasate and SF medium conditioned by monocytes or different types of macrophages. Western blot analysis of isolated proMMP-9 preparations was conducted under reducing conditions to determine the amount of TIMP-1 complexed with distinct proMMP-9 preparations. Note that the preparation of neutrophil proMMP-9 is completely devoid of TIMP-1 and that reduction led to collapsing of all neutrophil proMMP-9 forms to the 92-kDa monomer species. Positions of purified proMMP-9 monomer and the complexed 28-kDa TIMP-1 are indicated on the left. Positions of molecular weight markers are indicated on the right. Bar graph, stoichiometric ratio of proMMP-9 to TIMP-1 in purified preparations of proMMP-9 from monocytes and macrophages was calculated based on standard amounts of recombinant proMMP-9 and TIMP-1, which were run in parallel in additional lanes of the same gel (supplemental Figure 1C). ***P < .0001. (C) Gene expression analysis of MMP9 and TIMP1 during IL-4–mediated M2 polarization. M0 macrophages were introduced to 20 ng/mL IL-4, and mRNA was extracted from the cells at the indicated time points. Gene expression was analyzed by quantitative reverse transcriptase-polymerase chain reaction relative to the levels of the corresponding gene (1.0) before addition of IL-4 (0 hours). Presented are data from 1 of 4 independent experiments run in triplicates. ***P < .0001. (D) Western blot analysis of MMP-9 and TIMP-1 secretion during IL-4–mediated M2 polarization. M0 macrophages were introduced to IL-4 for the indicated time (hours) and then switched to SF conditions. Following a 48-hour incubation, the samples of CM were analyzed for MMP-9 and TIMP-1 by western blotting. (E) IL-mediated regulation of MMP-9 and TIMP-1 in M2 macrophages. M0 macrophages were introduced to 20 ng/mL of human IL-4, IL-10, and IL-13, or left nontreated (NT). Following a 24-hour induction, the cells were switched to SF medium, and CM as collected after 48 hours. CM was analyzed for MMP-9 and TIMP-1 by western blotting. Samples of CM were normalized to equal number of cells and processed by SDS PAGE on 4% to 20% gels under reducing conditions. After transferring of separated proteins, the membrane was cut horizontally, and the upper potion probed with anti–MMP-9 antibody and the lower portion with anti–TIMP-1 antibody. The position of the molecular weight markers is indicated on the right. (F) Angiogenic potential of IL-activated macrophages. Angiogenic potency of CM from M0 macrophages induced by different ILs was analyzed in the CAM assy. Data are from 1 of 3 independent experiments, each involving from 4 to 6 chick embryos with 5 to 6 collagen onplants. Bar graph presents means ± SEM of fold changes in the levels of angiogenesis compared with SF control (1.0). **P < .005 and ***P < .0001 in comparison with nontreated (NT) macrophages.
Figure 6
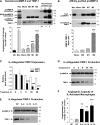
TIMP-1–deficient status determines high angiogenic capacity of proMMP-9 produced by human M2-polarized macrophages. (A) Complexing of neutrophil and M2 macrophage proMMP-9 with TIMP-1. Purified TIMP-free neutrophil proMMP-9 and TIMP-deficient proMMP-9 produced by M2 macrophages was incubated with fivefold molar excess of TIMP-1 and repurified by affinity chromatography on gelatin Sepharose to remove unbound TIMP-1. The original and resulting preparations were analyzed by western blotting for 92-kDa MMP-9 and 28-kDa TIMP-1, confirming efficient complexing of TIMP-1 to proMMP-9. (B) Encumbrance by TIMP-1 abrogates high angiogenesis-inducing capacity of proMMP-9. Preparations of original and TIMP-1–complexed proMMP-9 from neutrophils and M2 macrophages were incorporated into collagen mixtures to provide 3 ng of proMMP-9 per onplant. The levels of angiogenesis were analyzed 3 days later in comparison with PBS control. The data are from a representative experiment performed using from 4 to 6 embryos, each grafted with 6 collagen onplants, per condition. The data are presented as fold changes (means ± SEM) in the levels of angiogenesis induced by different proMMP-9 preparations compared with PBS control (1.0). ***P < .0001. (C) Downregulation of TIMP-1 expression by siRNA treatment. After 7-day differentiation of monocytes into mature M0 macrophages and M0 macrophage polarization into M1 and M2 phenotypes, the cells were transfected with control or TIMP-1 siRNA constructs. CM from siRNA-treated mature M0 and polarized M1 and M2 macrophages was analyzed by western blotting for levels of proMMP-9 and TIMP-1. Note that TIMP-1 siRNA treatment did not affect the levels of proMMP-9 production, but significantly downregulated TIMP-1 expression in M0 and M1 macrophages. (D) Downregulation of TIMP-1 in the TIMP-1–expressing M0 and M2 macrophages induces their angiogenic capacity. Low levels of TIMP-1 expression and production correlates with high levels of angiogenesis induced by mature and polarized macrophages. Mature M0 and polarized M1 and M2 macrophages were treated with control or TIMP-1 siRNA and incorporated into collagen mixtures to provide 1 × 10⁴ cells per collagen onplant. Negative control contained no cells (NC). The data are presented as fold changes (means ± SEM) in the levels of angiogenesis compared with NC control (1.0). Note that significant downregulation of TIMP-1 in M0 and M1 macrophages results in a significant increase of their angiogenic capacity. **P < .01.
Figure 7
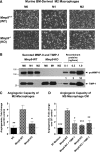
Angiogenic potential of murine BM-derived M2-macrophages depends on their TIMP-1-free proMMP-9. (A) Polarization of murine BM-derived macrophages. M0 macrophages were generated from WT mice (upper) or _Mmp9_-KO mice (lower) by incubation of BM cells in the presence of murine M-CSF. Following a 7-day maturation, M0 macrophages were incubated for 24 hours either in the mixture of IFNγ and LPS to induce the M1 phenotype or with IL-4 to induce the M2 phenotype. Phase contrast images were acquired using an Olympus CKX-41 microscope equipped with Olympus U-LS30-3 video camera and Infinity Capture software and processed using Adobe Photoshop. Objective lens, ×20. (B) Western blot analysis of MMP-9 and TIMP-1 produced by mature and polarized murine macrophages. Following maturation and polarization, murine macrophages were switched to SF medium. CM was collected 48 hours later and analyzed for production of MMP-9 and TIMP-1. Control proteins, murine recombinant proMMP-9 (105 kDa) and TIMP-1 (28 kDa), were loaded in the wells of the same gel to provide the means of quantification. After SDS-PAGE and transfer, the membrane was cut horizontally, and the upper potion was probed with anti-murine MMP-9 antibody, whereas the lower potion was probed with anti–TIMP-1 antibody. The position of molecular weight markers is indicated on the left. (C) Angiogenic capacity of murine M2 macrophages depends on expression of MMP-9. Intact M2 macrophages generated from BM of WT or _Mmp9_-KO mice were incorporated into 3D collagen onplants and analyzed in the CAM angiogenesis assay. SF medium was used as a negative no-cell (NC) control. The data are from 2 independent experiments, each involving from 4 to 6 embryos, each bearing from 5 to 6 onplants. Bar graph presents means ± SEM of fold changes in the levels of angiogenesis compared with NC control (1.0). *P < .05 and **P < .01 in comparison with angiogenesis levels induced by WT M2 macrophages. (D) Angiogenic capacity of murine M2 macrophages is sensitive to TIMP-1. M2 macrophages generated from BM of WT or _Mmp9_-KO mice were incubated in SF medium for 48 hours. CM was incorporated into 3D collagen onplants alone or with 4 ng of recombinant murine TIMP-1 per onplant. SF medium was used as a negative control. Data are from 2 independent CAM experiments, each involving from 4 to 6 embryos per variant (5-6 onplants per embryo). Bar graph presents means ± SEM of fold changes in the levels of angiogenesis compared with SF control (1.0). *P < .05, **P < .01, and ***P < .0001, all in comparison with angiogenesis levels induced by WT M2 macrophages.
Similar articles
- Human neutrophils uniquely release TIMP-free MMP-9 to provide a potent catalytic stimulator of angiogenesis.
Ardi VC, Kupriyanova TA, Deryugina EI, Quigley JP. Ardi VC, et al. Proc Natl Acad Sci U S A. 2007 Dec 18;104(51):20262-7. doi: 10.1073/pnas.0706438104. Epub 2007 Dec 11. Proc Natl Acad Sci U S A. 2007. PMID: 18077379 Free PMC article. - Tissue-infiltrating neutrophils constitute the major in vivo source of angiogenesis-inducing MMP-9 in the tumor microenvironment.
Deryugina EI, Zajac E, Juncker-Jensen A, Kupriyanova TA, Welter L, Quigley JP. Deryugina EI, et al. Neoplasia. 2014 Oct 23;16(10):771-88. doi: 10.1016/j.neo.2014.08.013. eCollection 2014 Oct. Neoplasia. 2014. PMID: 25379015 Free PMC article. - Neutrophil MMP-9 proenzyme, unencumbered by TIMP-1, undergoes efficient activation in vivo and catalytically induces angiogenesis via a basic fibroblast growth factor (FGF-2)/FGFR-2 pathway.
Ardi VC, Van den Steen PE, Opdenakker G, Schweighofer B, Deryugina EI, Quigley JP. Ardi VC, et al. J Biol Chem. 2009 Sep 18;284(38):25854-66. doi: 10.1074/jbc.M109.033472. Epub 2009 Jul 16. J Biol Chem. 2009. PMID: 19608737 Free PMC article. - Identification of a novel 82 kDa proMMP-9 species associated with the surface of leukaemic cells: (auto-)catalytic activation and resistance to inhibition by TIMP-1.
Ries C, Pitsch T, Mentele R, Zahler S, Egea V, Nagase H, Jochum M. Ries C, et al. Biochem J. 2007 Aug 1;405(3):547-58. doi: 10.1042/BJ20070191. Biochem J. 2007. PMID: 17489740 Free PMC article. - Beneficial and detrimental influences of tissue inhibitor of metalloproteinase-1 (TIMP-1) in tumor progression.
Hornebeck W, Lambert E, Petitfrère E, Bernard P. Hornebeck W, et al. Biochimie. 2005 Mar-Apr;87(3-4):377-83. doi: 10.1016/j.biochi.2004.09.022. Biochimie. 2005. PMID: 15781325 Review.
Cited by
- Iron Oxide Nanoparticles Engineered Macrophage-Derived Exosomes for Targeted Pathological Angiogenesis Therapy.
Zhang H, Mao Y, Nie Z, Li Q, Wang M, Cai C, Hao W, Shen X, Gu N, Shen W, Song H. Zhang H, et al. ACS Nano. 2024 Mar 12;18(10):7644-7655. doi: 10.1021/acsnano.4c00699. Epub 2024 Feb 27. ACS Nano. 2024. PMID: 38412252 Free PMC article. - Macrophages Are Key Regulators of Stem Cells during Skeletal Muscle Regeneration and Diseases.
Dort J, Fabre P, Molina T, Dumont NA. Dort J, et al. Stem Cells Int. 2019 Jul 14;2019:4761427. doi: 10.1155/2019/4761427. eCollection 2019. Stem Cells Int. 2019. PMID: 31396285 Free PMC article. Review. - Depletion of γδ T Cells Leads to Reduced Angiogenesis and Increased Infiltration of Inflammatory M1-like Macrophages in Ischemic Muscle Tissue.
Arnholdt C, Kumaraswami K, Götz P, Kübler M, Lasch M, Deindl E. Arnholdt C, et al. Cells. 2022 Apr 29;11(9):1490. doi: 10.3390/cells11091490. Cells. 2022. PMID: 35563796 Free PMC article. - Monocytes and Macrophages in Cancer: Unsuspected Roles.
Gouveia-Fernandes S. Gouveia-Fernandes S. Adv Exp Med Biol. 2020;1219:161-185. doi: 10.1007/978-3-030-34025-4_9. Adv Exp Med Biol. 2020. PMID: 32130699 Review. - Macrophages in homeostatic immune function.
Jantsch J, Binger KJ, Müller DN, Titze J. Jantsch J, et al. Front Physiol. 2014 May 5;5:146. doi: 10.3389/fphys.2014.00146. eCollection 2014. Front Physiol. 2014. PMID: 24847274 Free PMC article. Review.
References
- Galdiero MR, Garlanda C, Jaillon S, Marone G, Mantovani A. Tumor associated macrophages and neutrophils in tumor progression. J Cell Physiol. 2013;228(7):1404–1412. - PubMed
- De Palma M, Lewis CE. Macrophage regulation of tumor responses to anticancer therapies. Cancer Cell. 2013;23(3):277–286. - PubMed
Publication types
MeSH terms
Substances
Grants and funding
- R01CA157792/CA/NCI NIH HHS/United States
- R01CA105412/CA/NCI NIH HHS/United States
- R01 CA105412/CA/NCI NIH HHS/United States
- UL1 TR000109-05/TR/NCATS NIH HHS/United States
- R01 CA157792/CA/NCI NIH HHS/United States
- UL1 TR000109/TR/NCATS NIH HHS/United States
LinkOut - more resources
Full Text Sources
Other Literature Sources
Molecular Biology Databases
Research Materials
Miscellaneous
