Neuronal activity in the preoptic hypothalamus during sleep deprivation and recovery sleep - PubMed (original) (raw)
Neuronal activity in the preoptic hypothalamus during sleep deprivation and recovery sleep
Md Aftab Alam et al. J Neurophysiol. 2014 Jan.
Abstract
The preoptic hypothalamus is implicated in sleep regulation. Neurons in the median preoptic nucleus (MnPO) and the ventrolateral preoptic area (VLPO) have been identified as potential sleep regulatory elements. However, the extent to which MnPO and VLPO neurons are activated in response to changing homeostatic sleep regulatory demands is unresolved. To address this question, we continuously recorded the extracellular activity of neurons in the rat MnPO, VLPO and dorsal lateral preoptic area (LPO) during baseline sleep and waking, during 2 h of sleep deprivation (SD) and during 2 h of recovery sleep (RS). Sleep-active neurons in the MnPO (n = 11) and VLPO (n = 13) were activated in response to SD, such that waking discharge rates increased by 95.8 ± 29.5% and 59.4 ± 17.3%, respectively, above waking baseline values. During RS, non-rapid eye movement (REM) sleep discharge rates of MnPO neurons initially increased to 65.6 ± 15.2% above baseline values, then declined to baseline levels in association with decreases in EEG delta power. Increase in non-REM sleep discharge rates in VLPO neurons during RS averaged 40.5 ± 7.6% above baseline. REM-active neurons (n = 16) in the LPO also exhibited increased waking discharge during SD and an increase in non-REM discharge during RS. Infusion of A2A adenosine receptor antagonist into the VLPO attenuated SD-induced increases in neuronal discharge. Populations of LPO wake/REM-active and state-indifferent neurons and dorsal LPO sleep-active neurons were unresponsive to SD. These findings support the hypothesis that sleep-active neurons in the MnPO and VLPO, and REM-active neurons in the LPO, are components of neuronal circuits that mediate homeostatic responses to sustained wakefulness.
Keywords: REM sleep; adenosine; median preoptic nucleus; sleep homeostasis; ventrolateral preoptic area.
Figures
Fig. 1.
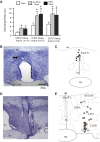
Sleep-active neurons in the median preoptic nucleus (MnPO) and lateral preoptic area (LPO). A: mean baseline sleep-wake discharge rates (DR) for groups of sleep-active neurons in the MnPO, ventrolateral preoptic area (VLPO) and dorsal lateral preoptic area (DLPO) that were studied under conditions of sleep deprivation (SD) and recovery sleep (RS). *Significantly different from wake values. B: coronal sections at the level of the rostral preoptic hypothalamus containing marking lesion (arrow) indicating the end of a microwire track targeting the MnPO. C: reconstruction of locations of sleep-active neurons in the MnPO. D: coronal section at the level of the preoptic hypothalamus, showing the course of a dorsal to ventral microwire bundle pass through the LPO. E: reconstruction of the locations of sleep-active neurons recorded in the VLPO (black circles) and DLPO (open circles). 3V, third ventricle; ac, anterior commissure; BSTMV, bed nucleus of the stria terminalis, medial ventral; HDB, horizontal limb of the diagonal band of Broca; MPA, medial preoptic area; ox, optic chiasm; PS, parastrial nucleus; REM, rapid eye movement.
Fig. 2.
Responses of an MnPO sleep-active neuron to SD. A: from top to bottom, DR histogram (spikes/s), cortical EEG and neck muscle EMG recordings during baseline, SD and RS. Black and gray arrowheads at the top indicate start and end of SD, respectively. The dots between the arrows indicate times when the animal attempted to initiate sleep and the experimenter had to intervene to maintain wakefulness. Note how the frequency of sleep attempts increases with increasing duration of SD. See text for further explanation. B_–_E: expansion of areas labeled in A, showing 10 min of recording during baseline (B), the first 30 min of SD (C), the last 30 min of SD (D) and early RS (E). The waveforms at the right of B_–_E are superimposed, and averaged action potentials recorded the 10 min shown in each figure, demonstrating stability of unit recording across all three experimental conditions. NREM, non-REM.
Fig. 3.
Summary of the effects of SD and RS on the discharge of MnPO sleep-active neurons (n = 11). A: mean waking DR, expressed as %change (Δ) from baseline waking values, across 30-min quartiles of the 2-h SD period. There was a significant overall effect of duration of SD on waking DR [F(10,3) = 12.3, P < 0.001]. B: there was also a significant effect of duration of SD on the number of sleep attempts [F(10,3) = 114.0, P < 0.001]. For A and B, **significantly different from all other values, Holm-Sidak test. C: mean DR during recovery NREM sleep, expressed as %change from baseline NREM sleep values. There was a significant overall effect of duration of RS on NREM sleep DR [F(10,3)=10.9, P < 0.001]. D: there was a significant effect of duration of RS on EEG slow-wave activity (SWA) in NREM sleep, expressed as a percentage of baseline NEM sleep values [F(10,3) = 35.6, P < 0.001]. For C and D, **significantly different from all other values; *significantly different from values at 61–90 and 91–120 min; #significantly different from value at 91–120 min, Holm-Sidak test.
Fig. 4.
Summary of the effects of SD and RS on the discharge of VLPO sleep-active neurons (n = 13) and DLPO sleep-active neurons (n = 9). A: mean waking DR, expressed as %change from baseline waking values, across 30-min quartiles of the 2-h SD period. There was a significant overall effect of duration of SD on waking DR for VLPO sleep-active neurons [F(12,3) = 13.3, P < 0.001]. There was no significant effect of duration of SD on waking DR for DLPO neurons [F(8,3) = 0.6, nonsignificant (ns)]. B: there was a significant and comparable effect of duration of SD on the number of sleep attempts for experiments involving both VLPO neurons [F(12,3) = 150.3, P < 0.001] and DLPO neurons [F(8,3) = 130.9, P < 0.001]. For A and B, **significantly different from all other values, P < 0.01; *significantly different from values at 1–30 min, Holm-Sidak test. C: mean DR during recovery NREM sleep, expressed as %change from baseline NREM sleep values, for VLPO and DLPO sleep-active neurons. There was a significant overall effect of duration of RS on NREM sleep DR for VLPO sleep-active neurons [F(12,3) = 4.6, P < 0.05], but not for DLPO sleep-active neurons [F(8,3) = 0.6, ns]. D: there was a significant effect of duration of RS on EEG SWA in NREM sleep, expressed as a percentage of baseline NREM sleep values, for experiments involving both VLPO neurons [F(10,3) = 12.7, P < 0.001] and DLPO neurons [F(8,3) = 7.4, P < 0.01]. For C and D, #significantly different from values at 61–90 min and 91–120 min; *significantly different from values at 91–120 min, Holm-Sidak test.
Fig. 5.
Effects of local perfusion of A2A receptor antagonist, ZM-241385, on discharge of a VLPO sleep-active neuron during SD and RS. A: from top to bottom, DR histogram (spikes/s), cortical EEG and neck muscle EMG recordings during 40-min baseline waking and sleep, during 120 min of SD and 120 min of RS. Just prior to the end of the SD period, perfusion was switched from vehicle [artificial cerebrospinal fluid (aCSF) + 4% DMSO] to 50 μM ZM-241385 for 10 min (arrows), then back to vehicle for the remainder of the recording. B: in the baseline condition, discharge of the cell was strongly sleep-related. A: the cell increased waking discharge, compared with baseline waking, during the second hour of SD. Perfusion of ZM-241385 evoked suppression of waking discharge during the final 10 min of SD. C and B: the cell exhibited marked suppression of NREM sleep discharge during initial RS following ZM-24185 administration, compared with baseline NREM discharge. D: discharge suppression persisted throughout RS, eventually returning to baseline levels during the final 30 min of the RS period. To demonstrate stability of unit recording before and after drug perfusion, figures at right of B_–_D are averaged action potentials and the superimposed action potentials on which the average waveforms were calculated.
Fig. 6.
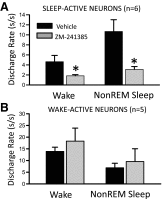
Effects of perfusion of A2A receptor antagonist, ZM-241385, on the state-dependent discharge of VLPO sleep-active neurons. A: DR of 6 VLPO sleep-active neurons were quantified during baseline perfusion of aCSF and following a 10- to 15-min perfusion of ZM-241385 (50 μM in aCSF). For 4 cells, drug perfusion was initiated after 90–100 min of SD, and for 2 other cells drug was perfused during spontaneous sleep-wake occurring between ZT2 and ZT4. There was a significant decrease in waking DR (paired _t_-test, t = 2.58, df = 5, *P < 0.05) and NREM sleep DR (t = 3.46, df = 5, *P < 0.05) following ZM-241385 perfusion compared with baseline. B: perfusion of ZM-241385 had no effect on waking and NREM sleep DR in a group of 5 wake-active neurons recorded in the VLPO region.
Fig. 7.
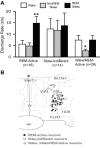
REM sleep-active, wake/REM-active and state-indifferent neurons in the LPO. A: mean baseline sleep-wake DR (±SEM) for the different LPO cell types that were studied under conditions of baseline, SD and RS. There was a significant overall effect of sleep-waking state on the discharge of REM-active neurons [F(15,2) = 39.7, P < 0.001], on the discharge of wake/REM-active neurons [F(27,2) = 14.9, P < 0.001], but not on the discharge of state-indifferent neurons [F(13,2) = 1.0, ns]. Significantly different from all other values, *P < 0.05; **P < 0.01. Holm-Sidak test. B: drawing of a coronal section at the level of the preoptic hypothalamus showing the locations of REM-related neurons (black circles), wake/REM-active neurons (gray circles) and state-indifferent neurons (open circles).
Fig. 8.
Response of an LPO REM sleep-active neuron to SD. A: continuous recording of EEG and EMG and DR histogram of unit activity during baseline sleep and waking, 2 h of SD and RS. B: Expansion of areas labeled in A, demonstrating increases in waking DR during the final 30 min of SD (B2) compared with baseline waking (B1). Waveforms at the right of each panel are superimposed (top) and mean (bottom) action potentials recorded during the 2 min shown. C: expansion of areas labeled in A demonstrating increases in NREM sleep DR during the first 30 min of RS (C2) compared with baseline NREM sleep (C1). D: DR during recovery REM sleep (D2) were similar to DR during baseline REM sleep (D1).
Fig. 9.
Summary of the effects of SD and selective REM-SD on the discharge of REM-active neurons in the LPO. A: there was a significant overall effect of the duration of SD on the waking discharge of REM-active neurons [F(15,3) = 9.4, P < 0.001]. B: there was also a significant overall effect of the duration of RS after SD on NREM sleep discharge of REM-active cells [F(15,3) = 6.6, P < 0.001]. C: in contrast to SD, there was no significant effect of duration of selective REM-SD on the waking discharge of a separate group of 10 REM-active neurons [F(9,3) = 1.9, ns]. D: there was also no significant effect of the duration of RS that followed 2 h of REM-SD on the NREM sleep discharge of REM-active neurons [F(9,3) = 2.7, ns]. *Significantly different from values at 1–30 min; #significantly different from values at 31–60 min, Holm-Sidak test. **Significantly different from all other values.
Similar articles
- Characteristics of sleep-active neurons in the medullary parafacial zone in rats.
Alam MA, Kostin A, Siegel J, McGinty D, Szymusiak R, Alam MN. Alam MA, et al. Sleep. 2018 Oct 1;41(10):zsy130. doi: 10.1093/sleep/zsy130. Sleep. 2018. PMID: 29986116 Free PMC article. - The role of adenosine in the maturation of sleep homeostasis in rats.
Gvilia I, Suntsova N, Kostin A, Kalinchuk A, McGinty D, Basheer R, Szymusiak R. Gvilia I, et al. J Neurophysiol. 2017 Jan 1;117(1):327-335. doi: 10.1152/jn.00675.2016. Epub 2016 Oct 26. J Neurophysiol. 2017. PMID: 27784808 Free PMC article. - Calcium Dynamics of the Ventrolateral Preoptic GABAergic Neurons during Spontaneous Sleep-Waking and in Response to Homeostatic Sleep Demands.
Kostin A, Alam MA, Saevskiy A, Yang C, Golshani P, Alam MN. Kostin A, et al. Int J Mol Sci. 2023 May 5;24(9):8311. doi: 10.3390/ijms24098311. Int J Mol Sci. 2023. PMID: 37176016 Free PMC article. - Hypothalamic regulation of sleep and arousal.
Szymusiak R, McGinty D. Szymusiak R, et al. Ann N Y Acad Sci. 2008;1129:275-86. doi: 10.1196/annals.1417.027. Ann N Y Acad Sci. 2008. PMID: 18591488 Review. - The Sleep-Promoting Ventrolateral Preoptic Nucleus: What Have We Learned over the Past 25 Years?
Arrigoni E, Fuller PM. Arrigoni E, et al. Int J Mol Sci. 2022 Mar 8;23(6):2905. doi: 10.3390/ijms23062905. Int J Mol Sci. 2022. PMID: 35328326 Free PMC article. Review.
Cited by
- Preoptic Area Modulation of Arousal in Natural and Drug Induced Unconscious States.
Reitz SL, Kelz MB. Reitz SL, et al. Front Neurosci. 2021 Feb 12;15:644330. doi: 10.3389/fnins.2021.644330. eCollection 2021. Front Neurosci. 2021. PMID: 33642991 Free PMC article. Review. - Circadian Rhythms of the Hypothalamus: From Function to Physiology.
Van Drunen R, Eckel-Mahan K. Van Drunen R, et al. Clocks Sleep. 2021 Feb 25;3(1):189-226. doi: 10.3390/clockssleep3010012. Clocks Sleep. 2021. PMID: 33668705 Free PMC article. Review. - Sex- and Age-dependent Differences in Sleep-wake Characteristics of Fisher-344 Rats.
Kostin A, Alam MA, Siegel JM, McGinty D, Alam MN. Kostin A, et al. Neuroscience. 2020 Feb 10;427:29-42. doi: 10.1016/j.neuroscience.2019.11.046. Epub 2019 Dec 14. Neuroscience. 2020. PMID: 31846749 Free PMC article. - Activation of the Ventrolateral Preoptic Neurons Projecting to the Perifornical-Hypothalamic Area Promotes Sleep: DREADD Activation in Wild-Type Rats.
Kostin A, Alam MA, Saevskiy A, McGinty D, Alam MN. Kostin A, et al. Cells. 2022 Jul 7;11(14):2140. doi: 10.3390/cells11142140. Cells. 2022. PMID: 35883583 Free PMC article. - Orexin neurons inhibit sleep to promote arousal.
De Luca R, Nardone S, Grace KP, Venner A, Cristofolini M, Bandaru SS, Sohn LT, Kong D, Mochizuki T, Viberti B, Zhu L, Zito A, Scammell TE, Saper CB, Lowell BB, Fuller PM, Arrigoni E. De Luca R, et al. Nat Commun. 2022 Jul 18;13(1):4163. doi: 10.1038/s41467-022-31591-y. Nat Commun. 2022. PMID: 35851580 Free PMC article.
References
- Alam MN, McGinty D, Bashir T, Kumar S, Imeri L, Opp M, Szymusiak R. Interleukin-1beta modulates state-dependent discharge activity of preoptic area and basal forebrain neurons: role in sleep regulation. Eur J Neurosci 29: 207–216, 2004 - PubMed
- Alam MN, McGinty D, Szymusiak R. Neuronal discharge of preoptic/anterior hypothalamic thermosensitive neurons: relation to NREM sleep. Am J Physiol Regul Integr Comp Physiol 269: R1240–R1249, 1995 - PubMed
- Baker FC, Shah S, Stewart D, Angara C, Gong H, Szymusiak R, Opp MR, McGinty D. Interleukin 1b enhances non-rapid eye movement sleep and increases c-Fos protein expression in the median preoptic nucleus of the hypothalamus. Am J Physiol Regul Integr Comp Physiol 288: R998–R1005, 2005 - PubMed
Publication types
MeSH terms
LinkOut - more resources
Full Text Sources
Other Literature Sources


