Polycomb repressive complex 2 regulates normal hematopoietic stem cell function in a developmental-stage-specific manner - PubMed (original) (raw)
Polycomb repressive complex 2 regulates normal hematopoietic stem cell function in a developmental-stage-specific manner
Huafeng Xie et al. Cell Stem Cell. 2014.
Abstract
Recent studies point to a pivotal role of Polycomb repressive complex 2 (PRC2) in stem cell function and cancer. Loss-of-function approaches targeting individual PRC2 subunits have, however, generated findings that are difficult to reconcile. Here, we prevent assembly of both Ezh1- and Ezh2-containing PRC2 complexes by conditional deletion of Eed, a core subunit, and assess hematopoiesis. We find that deletion of Eed exhausts adult bone marrow hematopoietic stem cells (HSCs), although fetal liver HSCs are produced in normal numbers. Eed-null neonatal HSCs express HSC signature genes but are defective in maintenance and differentiation. Comparative gene expression profiling revealed that neonatal and adult HSCs lacking Eed upregulated gene sets of conflicting pathways. Deletion of Cdkn2a, a PRC2 target gene, in Eed-null mice enhances hematopoietic stem/progenitor cell (HSPC) survival but fails to restore HSC functions. Taken together, our findings define developmental-stage-specific requirements for canonical PRC2 complexes in normal HSC function.
Copyright © 2014 Elsevier Inc. All rights reserved.
Figures
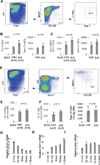
Figure 1. Loss of Ezh2 does not significantly affect the frequencies and numbers of LT-HSCs in FL and neonatal BM
(A) Sample plots of FACS analysis for FL LT-HSCs. (B–C) Comparison of frequencies and total cell numbers of LT-HSCs from E14.5 (B) and E17.5 (C) FLs between _Ezh2_Fl/Fl (_Ezh2_Fl/Fl_Vav_Wt) and _Ezh2_Δ/Δ (_Ezh2_KO) embryos. Data are shown as mean ± SD. (D) Sample plots of FACS analysis for BM LT-HSCs. (E–F) Comparison of BM LT-HSC frequencies and total cell numbers for 9-day-old (E) and 15-day-old (F) _Ezh2_Fl/Fl and _Ezh2_KO neonates. Data are shown as mean ± SD. (G–I) qRT-PCR analysis of Ezh1, Ezh2 and Eed mRNAs in LT-HSCs from E14.5 FLs and from different age mouse BM. After normalized with expression value of GAPDH, expression values of indicated genes in samples presented in each plot are compared to the smallest number within the group, which is set to 1. Data are shown as mean ± SD.
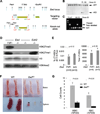
Figure 2. Eed deletion causes pancytopenia in neonates without affecting FL LT-HSCs
(A) Schematic diagram of the Eed locus, the targeting vector and the knockout allele. Light blue boxes depict exons of Eed; heavier lines represent introns of Eed gene and other genomic sequences. (B) Southern blot validation of gene targeting. (C) PCR validation of neomycin cassette excision. (D) Western blot validation of a complete loss of H3K27 methylation in _Eed_−/− ES cells, compared to _Eed_Fl/Fl and _Ezh2_−/− ES cells. (E) Comparison of frequencies (left) and total numbers per FL (right) of LT-HSCs between _Eed_Fl/FL (_Eed_Fl/Fl_Vav_Wt) and _Eed_Δ/Δ (_Eed_KO) E17.5 FLs. Data are shown as mean ± SD. (F) Representative photos of bones and spleens of 9-day-old WT and _Eed_KO mice. (G) Total white and red blood cell counts of 9-day-old WT (n=4) and _Eed_KO (n=5) mice. Data are shown as mean ± SD. See also Figure S1.
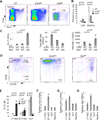
Figure 3. _Eed_KO BM HSCs are defective in differentiation
(A–B) Sample FACS plots (A) showing 9-day-old WT (n=5), _Ezh2_KO (n=5) and _Eed_KO (n=4) BM LSK and myeloid progenitor cells (MyePro, Lin−Sca-1−Kit+). The percentage of each population is plotted in graph (B). Data are presented as mean ± SD. (C) Comparison of LT-HSC frequencies (as percentage of total BM cells, left), total live BM cells per mouse (middle) and total BM LT-HSCs per mouse (right) between WT, _Ezh2_KO and _Eed_KO mice. Data are shown as mean ± SD. (D–E) Sample FACS plots comparing BM LT-HSCs, ST-HSCs and restricted lineage progenitors (RLP) of 9-day-old WT, _Ezh2_KO, and _Eed_KO BM (D) and the percentages are shown in the graph (E). Data are shown as mean ± SD. (F–H) Graphs comparing Ezh1, Ezh2 and Eed mRNA levels in 9-day-old WT BM LT-, ST-HSCs, RLPs and MyePro cells. After normalized with expression value of GAPDH, expression values of indicated genes in samples presented in each plot are compared to the smallest number within the group, which is set to 1. Data are shown as mean ± SD. See also Figure S2.
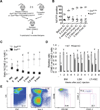
Figure 4. Loss of Eed in adult HSCs leads to their exhaustion
(A) Scheme of competitive BM transplantation for experiments conducted for (B) and (C). (B) Changes in percentage of EYFP positive cells (of CD45.2+ donor cells) before and at different time points after administration of pIpC. (C) Graph represents ratios of donor versus competitor derived cells (CD45.2 vs CD45.1) in the blood at different time points after pIpC administration. Data are shown as mean ± SD. (D–E) Graph (D) showing the relative ratios of CD45.1 vs CD45.2 BM cells, LSK cells and LT-HSCs at different time points after pIpC administration. Relative ratio is defined as the CD45.1 vs CD45.2 ratio of BM cells, LSK cells or LT-HSCs at certain time point post pIpC administration relative to the CD45.1 vs CD45.2 ratio of blood cells of the corresponding mouse before pIpC administration. Grey bars represent _Eed_Wt/Wt_M_×_1_Cre_Rosa26R_–EYFPFl/Wt cell (WT) recipients and black bars represent _Eed_Fl/Fl_M_×_1_Cre_Rosa26R_–EYFPFl/Wt cell (_Eed_KO) recipients. Data are shown as mean ± SD. Representative FACS plots distinguishing donor (CD45.1) versus competitor (CD45.2) derived BM LT-HSCs are shown in (E). See also Figure S3.
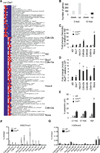
Figure 5. Loss of Eed in LT-HSCs derepresses PRC2 target genes
(A–B) Heatmap of the top up- or down-regulated genes (A) and overall gene expression changes upon Eed loss (B) in _Eed_KO BM LT-HSCs compared to controls. (C) Folds change of mRNA levels (mutant relative to WT) of indicated genes after loss of Ezh2 or Eed in neonatal BM LT-HSCs. Data are shown as mean ± SD. (D) Similar to (C) but comparing the expression of indicated genes after Eed loss in adult LT-HSCs. Data are shown as mean ± SD. (E) Percentages of apoptotic BM LT-, ST-HSCs and RLPs in neonatal WT, _Ezh2_KO or _Eed_KO BM. Data are shown as mean ± SD. (F–G) ChIP-qPCR analysis of H3K27me3 (F) and H3K9me3 (G) at the proximal promoter regions of indicated genes in FACS-sorted WT and Eed mutant LSK cells from adult BMs. Data are shown as mean ± SD. See also Figure S4 and S5.
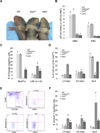
Figure 6. Deletion of Cdkn2a partially rescues Eed loss in hematopoiesis
(A) Representative photo of 8-day-old WT, _Eed_KO and DKO pups. (B) WBC and RBC counts of 9-day-old control and mutant pups. Data are shown as mean ± SD. (C–D) Deletion of Cdkn2a partially restores LSK and MyePro populations (C) as well as more primitive progenitors (D) in DKO. Data are shown as mean ± SD. (E–F) Deletion of Cdkn2a enhances HSPCs survival. Different HSPC populations are stained with Annexin V and DAPI (E) and the percentages of early apoptotic cells (Annexin V+DAPI−) are shown in graph (F). Data are shown as mean ± SD. See also Figure S6 and S7.
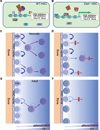
Figure 7
PRC2 regulates HSC differentiation and survival. (A) PRC2 suppresses target genes in WT HSCs. Purple ovals represent methyl groups. (B) Some PRC2 target genes are selectively derepressed in _Eed_KO BM HSCs. (C–D) WT (C) and _Eed_KO (D) neonatal BM HSCs self-renew and differentiate in a BM niche. Eed loss leads to a differentiation block (panel D, red bars) and apoptosis (panel D, cells with black dots) of some HSCs without significantly affecting HSC number. (E–F) Similar to C–D but showing WT (E) and Eed mutant (F) adult BM HSCs. Apoptosis becomes the dominant effect of Eed loss in adults, resulting in HSC failure.
References
- Bernstein BE, Mikkelsen TS, Xie X, Kamal M, Huebert DJ, Cuff J, Fry B, Meissner A, Wernig M, Plath K, et al. A bivalent chromatin structure marks key developmental genes in embryonic stem cells. Cell. 2006;125:315–326. - PubMed
- Cheng T, Rodrigues N, Shen H, Yang Y, Dombkowski D, Sykes M, Scadden DT. Hematopoietic stem cell quiescence maintained by p21cip1/waf1. Science. 2000;287:1804–1808. - PubMed
- Costa G, Mazan A, Gandillet A, Pearson S, Lacaud G, Kouskoff V. SOX7 regulates the expression of VE-cadherin in the haemogenic endothelium at the onset of haematopoietic development. Development. 2012;139:1587–1598. - PubMed
Publication types
MeSH terms
Substances
Grants and funding
- U01 CA105423/CA/NCI NIH HHS/United States
- HHMI/Howard Hughes Medical Institute/United States
- P30 DK049216/DK/NIDDK NIH HHS/United States
- K01DK093543/DK/NIDDK NIH HHS/United States
- K01 DK093543/DK/NIDDK NIH HHS/United States
LinkOut - more resources
Full Text Sources
Other Literature Sources
Medical
Molecular Biology Databases
Miscellaneous
