IL-9-mediated survival of type 2 innate lymphoid cells promotes damage control in helminth-induced lung inflammation - PubMed (original) (raw)
IL-9-mediated survival of type 2 innate lymphoid cells promotes damage control in helminth-induced lung inflammation
Jan-Eric Turner et al. J Exp Med. 2013.
Abstract
IL-9 fate reporter mice established type 2 innate lymphoid cells (ILC2s) as major producers of this cytokine in vivo. Here we focus on the role of IL-9 and ILC2s during the lung stage of infection with Nippostrongylus brasiliensis, which results in substantial tissue damage. IL-9 receptor (IL-9R)-deficient mice displayed reduced numbers of ILC2s in the lung after infection, resulting in impaired IL-5, IL-13, and amphiregulin levels, despite undiminished numbers of Th2 cells. As a consequence, the restoration of tissue integrity and lung function was strongly impaired in the absence of IL-9 signaling. ILC2s, in contrast to Th2 cells, expressed high levels of the IL-9R, and IL-9 signaling was crucial for the survival of activated ILC2s in vitro. Furthermore, ILC2s in the lungs of infected mice required the IL-9R to up-regulate the antiapoptotic protein BCL-3 in vivo. This highlights a unique role for IL-9 as an autocrine amplifier of ILC2 function, promoting tissue repair in the recovery phase after helminth-induced lung inflammation.
Figures
Figure 1.
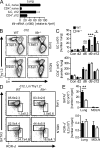
IL-9 expression in the lung during N. brasiliensis infection. (A) Flow cytometry of lung and MDLN cells from IL9CreR26ReYFP mice at days 2, 6, 12, and 20 after N. brasiliensis infection as well as from naive Il9CreR26ReYFP controls. Plots are gated for CD45+ lymphoid cells. Numbers represent percentage of eYFP+Thy1.2+ cells of total cells gated. (B and C) Absolute numbers of eYFP+Thy1.2+ cells in lungs (B) and MDLNs (C) at the respective time points (n = 3–4 per time point; **, P < 0.01; ***, P < 0.001). (D) IL-9 protein concentration in the lungs of _N. brasiliensis_–infected WT mice and in naive controls (day 0; n ≥ 4 per time point; *, P < 0.05; **, P < 0.01). (E) Flow cytometry of lung cells from IL9CreR26ReYFP mice stained for CD45, Thy1.2, CD4, and lineage markers (Lin, including CD3, CD4, CD8, CD11b, CD11c, CD19, CD49b, TCR-β, TCR-γ, NK1.1, GR-1, and Ter119) at day 12 after N. brasiliensis infection. Plots are gated for CD45+Thy1.2+ lymphoid cells, and numbers indicate the percentage of cells in each quadrant. (F) Ratio of eYFP+ ILCs and eYFP+CD4+ T cells at various time points after the infection (n = 3–4 per time point). (G) Absolute number of eYFP+ ILCs and eYFP+CD4+ T cells in lungs and MDLNs of IL9CreR26ReYFP mice at day 12 after N. brasiliensis infection (n = 4 per group; **, P = 0.003 vs. lung CD4). (H) Quantitative RT-PCR analysis of Il9 transcripts in eYFP+ ILCs and eYFP+CD4+ T cells, sorted by flow cytometry, from the lungs of IL9CreR26ReYFP mice at day 12 of N. brasiliensis infection (n = 3). Paired samples sorted from the same mice are connected with a line. mRNA expression was normalized to Hprt1 (encoding hypoxanthine guanine phosphoribosyltransferase). Data represent two independent experiments with similar results. Bars show mean values ± SEM.
Figure 2.
ILC2 accumulation in the lung tissue depends on IL-9R signaling. (A) Quantitative RT-PCR analysis of Il9r transcripts in Thy1.2+Lin− ILCs and CD4+ T cells, sorted by flow cytometry, from the lungs of naive WT mice and WT mice at day 12 of N. brasiliensis infection (n = 3). mRNA expression was normalized to Hprt1 (encoding hypoxanthine guanine phosphoribosyltransferase). (B) Flow cytometry plots of lung and MDLN cells from WT and Il9r−/− mice at day 12 after N. brasiliensis infection gated on CD45+ lymphoid cells. Numbers represent the percentage of Thy1.2+Lin− ILCs of total cells gated (n = 7–8 per group; mean value ± SEM). (C) Absolute numbers of ILCs and CD4+ T cells in lungs of WT and Il9r−/− mice at days 2–12 after the infection and in uninfected controls (Con; n ≥ 3 per group; *, P < 0.05; ***, P < 0.001). (D) Flow cytometry plots of lung and MDLN cells from WT and Il9r−/− mice at day 12 after N. brasiliensis infection stained for surface markers and intranuclear GATA3 and ROR-γt and gated on Thy1.2+Lin− ILCs. Numbers represent the percentage of transcription factor–positive ILCs of total cells gated (n = 7 per group; mean value ± SEM). (E) Absolute number of GATA3+ and ROR-γt+ ILCs in lungs and MDLNs of WT and Il9r−/− mice at day 12 of the infection (**, P = 0.001). Data in B–E are pooled from two independent experiments with similar results. Bars show mean values ± SEM.
Figure 3.
Cytokine production by ILC2s in the lung depends on IL-9R signaling. (A) Flow cytometry of total lung cells from _N. brasiliensis_–infected mice (day 12) restimulated with phorbol 12,13-dibutyrate and ionomycin for 2.5 h and stained intracellularly for IL-4, IL-5, and IL-13. Plots are gated for Th1.2+Lin− ILCs (left) and CD4+ T cells (right). Numbers indicate the percentage of cells in each quadrant. (B) Absolute number of IL-5–, IL-13–, and IL-4–positive ILC2s and CD4+ T cells in WT and Il9r−/− mice at days 6–12 of the infection (n = 3–8 per group; *, P < 0.05; **, P < 0.005; ***, P < 0.001). (C) Cytokine concentrations in the lungs of WT and Il9r−/− mice at days 6, 9, and 12 of the infection and in naive controls (Con; n = 3–7 per group; *, P < 0.05; **, P < 0.01; ***, P = 0.0006). Data in B and C are representative of at least two independent experiments with similar results. (D) Flow cytometry of total lung cells from _N. brasiliensis_–infected bone marrow chimera at day 12 restimulated with phorbol 12,13-dibutyrate and ionomycin for 2.5 h and stained intracellularly for IL-5 and IL-13. Plots are gated for Thy1.2+Lin− ILCs. Numbers in quadrants indicate percentage of cytokine-positive cells in the CD45.1− donor and CD45.1+ recipient ILC subset. (E) Absolute number of cytokine-positive CD45.1− donor ILCs in the lungs of the respective mice (***, P < 0.0001). Data represent two independent experiments with similar results (n = 4–6). Bars show mean values ± SEM.
Figure 4.
Delayed worm expulsion in Il9r−/− mice. (A) Egg count in feces of WT and Il9r−/− mice at days 3–8 after N. brasiliensis infection (n = 5–6 per time point and group; *, P < 0.05). (B) Worm number in the small intestine of WT and Il9r−/− mice at days 3, 9, and 12 after N. brasiliensis infection (n = 4–9 per time point and group; ***, P < 0.0001; ND, not detected). (C) Worm number in the small intestine of _N. brasiliensis_–infected bone marrow chimera at day 12 after infection (n = 7–10 per group; ***, P < 0.0007). Data represent two independent experiments with similar results. Bars show mean values ± SEM.
Figure 5.
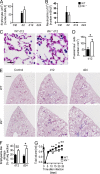
IL-9 is required for lung damage repair. (A and B) Number of erythrocytes (A) and neutrophils (B) in the bronchoalveolar lavage fluid (BALF) of WT and Il9r−/− mice at days 2, 12, and 24 of N. brasiliensis infection and in naive controls (Ctrl; n = 6–10 for experimental groups and n = 3–5 for controls). (C and D) Prussian blue staining for iron deposits in lung sections (C) and quantification of Prussian blue–positive (= hemophagocytic) macrophages (D) in _N. brasiliensis_–infected WT and Il9r−/− mice at day 12 (n = 7–8 per group; *, P = 0.04). (E and F) Masson’s trichrome staining of lung sections (E) and histological quantification of the emphysema-like lung damage (F) in lungs of WT and Il9r−/− mice at days 12 and 24 after the infection (n = 3–8 per group; *, P = 0.03; **, P = 0.007). Bars: (C) 25 µm; (E) 100 µm. (G) Tidal volume of WT and Il9r−/− mice shortly before and at different time points after the infection with N. brasiliensis (n = 5–18 per group; *, P = 0.02; **, P = 0.005). Data represent at least two independent experiments with similar results. Bars show mean values ± SEM.
Figure 6.
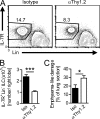
ILCs promote lung tissue repair after N. brasiliensis infection. (A) Flow cytometry plots of lung cells from isotype and α-Th1.2–treated mice at day 12 after N. brasiliensis infection gated on CD45+ lymphoid cells. Numbers represent the percentage of IL-7R+Lin− ILCs of total cells gated. (B) Absolute numbers of ILCs in the right lung of isotype and α-Th1.2–treated mice 12 d after the infection (n = 6–10; ***, P < 0.0001). (C) Histological quantification of the emphysema-like lung damage in lungs of isotype and α-Th1.2–treated mice at day 12 (n = 6–8 per group; *, P = 0.03). Data represent two independent experiments with similar results. Bars show mean values ± SEM.
Figure 7.
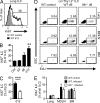
IL-9 signaling promotes eosinophil recruitment and alternative activation of macrophages. (A and D) Flow cytometry plots of lung cells from WT and Il9r−/− mice at day 9 after N. brasiliensis infection gated on CD11b+Ly6G− cells (A) and Ly6G−SiglecF− cells (D). Numbers represent the percentage of SiglecF+CD11c− eosinophils (A), SiglecF+CD11chi alveolar macrophages (A), and conventional CD11bhiF4/80+ macrophages/monocytes (D). (B, C, and E). Absolute numbers of eosinophils (B), alveolar macrophages (C), and macrophages/monocytes (E) at days 6–12 in the lung of WT and Il9r−/− mice (n ≥ 3 per group; *, P = 0.01; **, P = 0.003; ***, P < 0.004). (F) Quantitative RT-PCR analysis of mRNA transcripts in conventional lung macrophages, sorted by flow cytometry, from the lungs of WT and Il9r−/− mice at day 12 of N. brasiliensis infection (n = 5; **, P = 0.003). (G) Representative periodic acid–Schiff staining of lung sections in WT and Il9r−/− mice at day 12 of the infection. (H) Quantitative RT-PCR analysis of goblet cell–related transcripts in total lung RNA samples at day 12 after infection of WT and Il9r−/− mice and in naive controls (Con). (I and J) Representative immunohistochemical staining of lung sections for mast cell tryptase (I) and quantification of mast cell tryptase+ cells (J) in WT and Il9r−/− mice at day 12 of the infection. The inset shows granular mast cell tryptase staining at a higher magnification. Bars: (G) 100 µm; (I) 25 µm. (K and L) Quantitative RT-PCR analysis of mRNA transcripts in total lung RNA samples at day 12 after infection of WT and Il9r−/− mice and in naive controls (Con; H–L: n = 8–9 for day 12, n = 3 for controls). mRNA expression was normalized to Hprt1 (encoding hypoxanthine guanine phosphoribosyltransferase). Data represent at least two independent experiments with similar results. Bars show mean values ± SEM.
Figure 8.
Expression of ILC2-derived amphiregulin depends on IL-9 signaling. (A) Quantitative RT-PCR analysis of amphiregulin (Areg) transcripts in _IL9Cre_eYFP+ ILC2s, _IL9Cre_eYFP+ CD4+ T cells, _IL4_-GFP+ Th2 cells, eosinophils (Eos), and macrophages (MM) purified at day 12 of the infection from the lungs of IL9CreR26ReYFP, 4get (IL4GFP), and WT mice (n = 3–4 per group; **, P = 0.004; ND, not detected). (B and C) Quantitative RT-PCR analysis of amphiregulin (Areg) transcripts in sorted ILC2s (n = 4–5; B) and in total lung RNA samples (C) at days 9 and 12 after infection of WT and Il9r−/− mice and in naive controls (Con; n = 8–9 for day 12, n = 3 for controls; **, P = 0.004). Data are representative for two independent experiments. mRNA expression was normalized to Hprt1 (encoding hypoxanthine guanine phosphoribosyltransferase). Bars show mean values ± SEM.
Figure 9.
IL-9 is dispensable for ILC proliferation. (A) Flow cytometry of intranuclear Ki67 expression in lung ILCs from uninfected WT control mice and mice at day 12 after N. brasiliensis infection. The number represents the percentage of Ki67+ ILC2s at day 12. (B) Percentage of Ki67+ lung ILC2s at different time points (days 2–12) after N. brasiliensis infection and in naive controls (Ctrl; n = 3–4 per time point; **, P = 0.004 vs. control). (C) Percentage of Ki67+ ILC2s in the lungs of WT and Il9r−/− mice at day 12 of the infection (n = 5–7 per group; ***, P = 0.0007). (D) Flow cytometric assessment of EdU incorporation by Lin−Thy1.2+ ILCs in the lung, MDLNs, and bone marrow of uninfected WT controls, infected WT, and infected Il9r−/− mice at day 9, 2 h after i.v. injection of 1 mg EdU per mouse. Numbers represent EdU+ cells in the percentage of total ILCs. (E) Percentage of EdU+ (= proliferated within 2 h) ILCs in the lung, MDLNs, and bone marrow of the three groups (n = 4–5). Data in C–E represent two independent experiments with similar results. Bars show mean values ± SEM.
Figure 10.
IL-9 enhances cytokine production and survival of lung ILCs. (A) IL-13 and IL-5 protein concentration in the culture supernatant of ILC2s, sorted by flow cytometry, from the lungs of WT and Il9r−/− mice at day 12 after N. brasiliensis infection and cultured for 2 d with or without IL-9 (50 ng/ml in all experiments; n = 3–4 per group; ***, P < 0.0001). (B) Flow cytometry of lung ILC2s, sorted by flow cytometry, from infected WT mice (day 12) after 2 d of culture with and without IL-9. Numbers indicate the percentage of cells in each quadrant. (C) Percentage of live ILC2s (Annexin V−7AAD−) at day 2 of culture (n = 3–4 per group; ***, P = 0.0003). (D) Flow cytometry for forward scatter (FSC) gated on live ILC2s after 2 d of culture with and without IL-9. (E and F) Immunohistochemical staining of lung sections for cleaved caspase-3 (E) and quantification of cleaved caspase-3–positive lymphoid cells (F) in lungs of WT and Il9r−/− mice at day 12 after the infection (n = 7–8 per group; **, P = 0.005). Insets show caspase-3 staining at a higher magnification. Arrows indicate caspase-3–positive cells. Bar, 25 µm. Data represent at least two independent experiments with similar results. (G) Quantitative RT-PCR analysis of mRNA expression of antiapoptotic proteins in ILC2s, sorted by flow cytometry, from the lungs of WT and Il9r−/− mice at day 9 of N. brasiliensis infection (n = 6; *, P = 0.04). Bars show mean values ± SEM. (H) Flow cytometry for CD25 and IL-7R expression on ILC2s from the lungs of _N. brasiliensis_–infected WT and Il9r−/− mice.
Similar articles
- The neuropeptide neuromedin U stimulates innate lymphoid cells and type 2 inflammation.
Klose CSN, Mahlakõiv T, Moeller JB, Rankin LC, Flamar AL, Kabata H, Monticelli LA, Moriyama S, Putzel GG, Rakhilin N, Shen X, Kostenis E, König GM, Senda T, Carpenter D, Farber DL, Artis D. Klose CSN, et al. Nature. 2017 Sep 14;549(7671):282-286. doi: 10.1038/nature23676. Epub 2017 Sep 6. Nature. 2017. PMID: 28869965 Free PMC article. - Group 2 innate lymphoid cells utilize the IRF4-IL-9 module to coordinate epithelial cell maintenance of lung homeostasis.
Mohapatra A, Van Dyken SJ, Schneider C, Nussbaum JC, Liang HE, Locksley RM. Mohapatra A, et al. Mucosal Immunol. 2016 Jan;9(1):275-86. doi: 10.1038/mi.2015.59. Epub 2015 Jul 1. Mucosal Immunol. 2016. PMID: 26129648 Free PMC article. - Type 2 innate lymphoid cells constitutively express arginase-I in the naive and inflamed lung.
Bando JK, Nussbaum JC, Liang HE, Locksley RM. Bando JK, et al. J Leukoc Biol. 2013 Nov;94(5):877-84. doi: 10.1189/jlb.0213084. Epub 2013 Aug 7. J Leukoc Biol. 2013. PMID: 23924659 Free PMC article. - Group 2 innate lymphoid cells (ILC2s): The spotlight in asthma pathogenesis and lung tissue injury.
Sadik S, Lu Y, Zhu S, Cai J, Mi LL. Sadik S, et al. Allergol Immunopathol (Madr). 2021 Mar 1;49(2):208-216. doi: 10.15586/aei.v49i2.29. eCollection 2021. Allergol Immunopathol (Madr). 2021. PMID: 33641310 Review. - The Heterogeneity, Origins, and Impact of Migratory iILC2 Cells in Anti-helminth Immunity.
Miller MM, Reinhardt RL. Miller MM, et al. Front Immunol. 2020 Jul 23;11:1594. doi: 10.3389/fimmu.2020.01594. eCollection 2020. Front Immunol. 2020. PMID: 32793230 Free PMC article. Review.
Cited by
- The development and in vivo function of T helper 9 cells.
Kaplan MH, Hufford MM, Olson MR. Kaplan MH, et al. Nat Rev Immunol. 2015 May;15(5):295-307. doi: 10.1038/nri3824. Epub 2015 Apr 7. Nat Rev Immunol. 2015. PMID: 25848755 Free PMC article. Review. - Communication is key: Innate immune cells regulate host protection to helminths.
Peng J, Federman HG, Hernandez CM, Siracusa MC. Peng J, et al. Front Immunol. 2022 Sep 26;13:995432. doi: 10.3389/fimmu.2022.995432. eCollection 2022. Front Immunol. 2022. PMID: 36225918 Free PMC article. Review. - Interleukin 9 mediates T follicular helper cell activation to promote antibody responses.
Sato T, Ikegami I, Yanagi M, Ohyu T, Sugaya T, Shirato S, Tanemoto M, Kamiya S, Kikuchi K, Kamada Y, Nakata T, Kamekura R, Sato A, Takano KI, Miyajima M, Watanabe A, Ichimiya S. Sato T, et al. Front Immunol. 2024 Sep 30;15:1441407. doi: 10.3389/fimmu.2024.1441407. eCollection 2024. Front Immunol. 2024. PMID: 39403384 Free PMC article. - The modulation of pulmonary group 2 innate lymphoid cell function in asthma: from inflammatory mediators to environmental and metabolic factors.
Thio CL, Chang YJ. Thio CL, et al. Exp Mol Med. 2023 Sep;55(9):1872-1884. doi: 10.1038/s12276-023-01021-0. Epub 2023 Sep 11. Exp Mol Med. 2023. PMID: 37696890 Free PMC article. Review. - Group 2 Innate Lymphoid Cells in Respiratory Allergic Inflammation.
Helfrich S, Mindt BC, Fritz JH, Duerr CU. Helfrich S, et al. Front Immunol. 2019 Jun 7;10:930. doi: 10.3389/fimmu.2019.00930. eCollection 2019. Front Immunol. 2019. PMID: 31231357 Free PMC article. Review.
References
- Camberis M., Le Gros G., Urban J., Jr 2003. Animal model of Nippostrongylus brasiliensis and Heligmosomoides polygyrus. Curr. Protoc. Immunol. Chapter 19:Unit 19.12. - PubMed
Publication types
MeSH terms
Substances
Grants and funding
- MC_U117512792/MRC_/Medical Research Council/United Kingdom
- U.117512792/MRC_/Medical Research Council/United Kingdom
- MC_UP_A253_1028/MRC_/Medical Research Council/United Kingdom
LinkOut - more resources
Full Text Sources
Other Literature Sources
Medical
Research Materials


