Subpopulations of myeloid-derived suppressor cells impair T cell responses through independent nitric oxide-related pathways - PubMed (original) (raw)
. 2014 Jun 15;134(12):2853-64.
doi: 10.1002/ijc.28622. Epub 2013 Dec 3.
Paul Thevenot, Rosa Sierra, Dorota Wyczechowska, Daniel Halle, Maria E Ramirez, Augusto C Ochoa, Matthew Fletcher, Cruz Velasco, Anna Wilk, Krzysztof Reiss, Paulo C Rodriguez
Affiliations
- PMID: 24259296
- PMCID: PMC3980009
- DOI: 10.1002/ijc.28622
Subpopulations of myeloid-derived suppressor cells impair T cell responses through independent nitric oxide-related pathways
Patrick L Raber et al. Int J Cancer. 2014.
Abstract
The accumulation of myeloid-derived suppressor cells (MDSC) in tumor-bearing hosts is a hallmark of malignancy-associated inflammation and a major mediator for the induction of T cell suppression in cancer. MDSC can be divided phenotypically into granulocytic (G-MDSC) and monocytic (Mo-MDSC) subgroups. Several mechanisms mediate the induction of T cell anergy by MDSC; however, the specific role of these pathways in the inhibitory activity of MDSC subpopulations remains unclear. Therefore, we aimed to determine the effector mechanisms by which subsets of tumor-infiltrating MDSC block T cell function. We found that G-MDSC had a higher ability to impair proliferation and expression of effector molecules in activated T cells, as compared to Mo-MDSC. Interestingly, both MDSC subgroups inhibited T cells through nitric oxide (NO)-related pathways, but expressed different effector inhibitory mechanisms. Specifically, G-MDSC impaired T cells through the production of peroxynitrites (PNT), while Mo-MDSC suppressed by the release of NO. The production of PNT in G-MDSC depended on the expression of gp91(phox) and endothelial NO synthase (eNOS), while inducible NO synthase (iNOS) mediated the generation of NO in Mo-MDSC. Deletion of eNOS and gp91(phox) or scavenging of PNT blocked the suppressive function of G-MDSC and induced anti-tumoral effects, without altering Mo-MDSC inhibitory activity. Furthermore, NO-scavenging or iNOS knockdown prevented Mo-MDSC function, but did not affect PNT production or suppression by G-MDSC. These results suggest that MDSC subpopulations utilize independent effector mechanisms to regulate T cell function. Inhibition of these pathways is expected to specifically block MDSC subsets and overcome immune suppression in cancer.
Keywords: MDSC; eNOS; peroxynitrites.
© 2013 UICC.
Figures
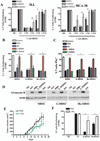
Figure 1. Suppression of T cell proliferation by MDSC subpopulations depends on nitric oxide synthases
A. CFSE labeled CD3+ T cells were co-cultured at different ratios with MDSC, G-MDSC, and Mo-MDSC positively isolated from 3LL or MCA-38 tumors. T cell proliferation was assessed by flow cytometry 72 hours later. NS indicates non-stimulated T cells, while 1:0 indicates T cells activated with anti-CD3/CD28 and cultured alone. B. T cells co-cultured with MDSC, G-MDSC, and Mo-MDSC at a 1:1/2 ratio were treated with NN (200 µM), L-NMMA (500 µM), and D-NMMA(500 µM). Then, proliferation was tested by flow cytometry. C. T cells negatively selected from B were tested for IFNγ production by intracellular staining. Values are from 3 similar experiments. D. A representative experiment from 3 showing western blot for granzyme B expression in T cells previously co-cultured with MDSC populations in the presence of NN and L-NMMA. E. Mice bearing 3LL tumors were treated daily with PBS (n=10) or L-NIL (20 mg/kg) (n=10), and tumor burden was assessed. F. G-MDSC and Mo-MDSC positively isolated from the tumors of each treatment group were co-cultured with naïve CD3+ T cells at a ratio of 1:1/4 and suppression was determined as described above. Values are from 3 similar experiments. * p < 0.05
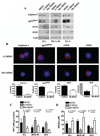
Figure 2. Differential expression of suppressive pathways in tumor-infiltrating MDSC subpopulations
A. Expression of arginase I, gp91phox, eNOS, and iNOS in MDSC, G-MDSC, and Mo-MDSC isolated from 3LL, MCA-38, and EL-4 tumors. Values are a representative experiment from 5 individual mice. B. The same panel of suppressive enzymes was determined by immuno cytology and the voxel per cell determined, as described in the methods. C. Nitrotyrosine ELISA of whole cell extracts from tumor isolated MDSC subpopulations was used to quantify PNT production (n=10). D. NO production by MDSC subsets was determined using Griess reagent (n=10).
Figure 3. MDSC subpopulations inhibit T cell proliferation through independent nitric-oxide related pathways
A. Co-cultures of activated CFSE-labeled T cells and G-MDSC subpopulations (ratio 1:1/2) were established in the presence of PNT scavenger MnTBAP (100 µM). Then, T cell proliferation was evaluated 72 hours later. B. Similar to experiment A, T cells: MDSC subsets (ratio 1:1/2) were cultured in the presence of PTIO (100 µM) and T cell proliferation tested after 72 hours. The experiments were repeated a minimum of 3 times obtaining similar results. * p < 0.01; Non-statistical significant differences (ns): _p_ > 0.05
Figure 4. G-MDSC suppress T cells by production of PNT derived from gp91phox and eNOS
A. PNT levels were evaluated by nitrotyrosine ELISA from whole cell extracts of MDSC subpopulations isolated from wild-type, eNOS −/−, and gp91phox−/− mice bearing 3LL tumors for 17 days (n=10). B–C. G-MDSC from wild-type, gp91phox−/− (B), or eNOS−/− (C) mice bearing 3LL tumors were co-cultured with CFSE labeled T cells to determine the suppressive capacity. The experiment was repeated a minimum of 3 times using independent tumor bearing mice obtaining similar results. * p < 0.01, Non-statistical significant differences (ns): _p_ > 0.05
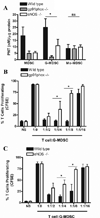
Figure 5. Mo-MDSC suppress T cell proliferation by NO production derived from iNOS
A. Comparison of nitrities from G-MDSC and Mo-MDSC isolated from wild-type and iNOS−/− mice bearing 3LL tumors for 17 days (n=10). B–C. Mo-MDSC (B) and G-MDSC (C) were collected from wild-type and iNOS−/− mice bearing 3LL tumors and co-cultured with CFSE labeled T cells. Proliferation of T cells was established 72 hours later. The experiment was repeated a minimum of 3 times obtaining similar results. D. PNT production from each population was analyzed by nitrotyrosine ELISA (n=9). * p < 0.01; Non-statistical significant differences (ns): _p_ > 0.05
Figure 6. Targeting MDSC subset-associated suppressive pathways blocks tumor growth
A. Accumulation of G-MDSC (CD11b+Ly6CLOW Ly6GHIGH) and Mo-MDSC (CD11b+ Ly6CHIGH Ly6GNEG-LOW) in tumors from mice injected with 3LL, B16, EL-4, or MCA-38 tumors. B. A representative experiment showing higher numbers of G-MDSC in 3LL tumors (n=10) and the preferential accumulation of Mo-MDSC in MCA-38 tumors (n=10). C. 3LL (upper panel) or MCA-38 (lower panel) cells were subcutaneously injected into wild-type and gp91phox−/− mice and tumor volume measured daily (n=10). D. To determine the role of PNT production on tumor burden, mice were subcutaneously injected with 3LL or MCA-38 cells and treated daily with the PNT scanvenger (MnTBAP) or PBS control (n=10). E. iNOS−/− mice were injected with 3LL or MCA-38 cells and their growth compared with wild type mice (n=10). * p < 0.01, Non-statistical significant differences (ns): _p_ > 0.05
Similar articles
- Tumor-induced myeloid-derived suppressor cell subsets exert either inhibitory or stimulatory effects on distinct CD8+ T-cell activation events.
Schouppe E, Mommer C, Movahedi K, Laoui D, Morias Y, Gysemans C, Luyckx A, De Baetselier P, Van Ginderachter JA. Schouppe E, et al. Eur J Immunol. 2013 Nov;43(11):2930-42. doi: 10.1002/eji.201343349. Epub 2013 Aug 25. Eur J Immunol. 2013. PMID: 23878002 - Modulation of CD8(+) T-cell activation events by monocytic and granulocytic myeloid-derived suppressor cells.
Schouppe E, Van Overmeire E, Laoui D, Keirsse J, Van Ginderachter JA. Schouppe E, et al. Immunobiology. 2013 Nov;218(11):1385-91. doi: 10.1016/j.imbio.2013.07.003. Epub 2013 Jul 15. Immunobiology. 2013. PMID: 23932436 Review. - Immunosuppressive effects and mechanisms of three myeloid-derived suppressor cells subsets including monocytic-myeloid-derived suppressor cells, granulocytic-myeloid-derived suppressor cells, and immature-myeloid-derived suppressor cells.
Nagatani Y, Funakoshi Y, Suto H, Imamura Y, Toyoda M, Kiyota N, Yamashita K, Minami H. Nagatani Y, et al. J Cancer Res Ther. 2021 Jul-Sep;17(4):1093-1100. doi: 10.4103/jcrt.JCRT_1222_20. J Cancer Res Ther. 2021. PMID: 34528569 - Contribution of iNOS/sGC/PKG pathway, COX-2, CYP4A1, and gp91(phox) to the protective effect of 5,14-HEDGE, a 20-HETE mimetic, against vasodilation, hypotension, tachycardia, and inflammation in a rat model of septic shock.
Tunctan B, Korkmaz B, Sari AN, Kacan M, Unsal D, Serin MS, Buharalioglu CK, Sahan-Firat S, Cuez T, Schunck WH, Manthati VL, Falck JR, Malik KU. Tunctan B, et al. Nitric Oxide. 2013 Sep 1;33:18-41. doi: 10.1016/j.niox.2013.05.001. Epub 2013 May 14. Nitric Oxide. 2013. PMID: 23684565 Free PMC article. - Myeloid-Derived Suppressor Cells in Trypanosoma cruzi Infection.
Fresno M, Gironès N. Fresno M, et al. Front Cell Infect Microbiol. 2021 Aug 27;11:737364. doi: 10.3389/fcimb.2021.737364. eCollection 2021. Front Cell Infect Microbiol. 2021. PMID: 34513737 Free PMC article. Review.
Cited by
- Current state of immune checkpoints therapy for glioblastoma.
Wang H, Yang J, Li X, Zhao H. Wang H, et al. Heliyon. 2024 Jan 13;10(2):e24729. doi: 10.1016/j.heliyon.2024.e24729. eCollection 2024 Jan 30. Heliyon. 2024. PMID: 38298707 Free PMC article. Review. - Granulocytic myeloid-derived suppressor cells to prevent and treat murine immune-mediated bone marrow failure.
Feng X, Kim J, Gonzalez-Matias G, Aggarwal N, Manley AL, Wu Z, Solorzano S, Batchu S, Gao S, Chen J, Young NS. Feng X, et al. Blood Adv. 2023 Jan 10;7(1):73-86. doi: 10.1182/bloodadvances.2022007254. Blood Adv. 2023. PMID: 35895513 Free PMC article. - Tumor metabolic crosstalk and immunotherapy.
Zhang Y, Nie Y, Liu X, Wan X, Shi Y, Zhang K, Wu P, He J. Zhang Y, et al. Clin Transl Oncol. 2024 Apr;26(4):797-807. doi: 10.1007/s12094-023-03304-4. Epub 2023 Sep 23. Clin Transl Oncol. 2024. PMID: 37740892 Review. - New Perspectives on Myeloid-Derived Suppressor Cells and Their Emerging Role in Haematology.
Bizymi N, Matthaiou AM, Matheakakis A, Voulgari I, Aresti N, Zavitsanou K, Karasachinidis A, Mavroudi I, Pontikoglou C, Papadaki HA. Bizymi N, et al. J Clin Med. 2022 Sep 10;11(18):5326. doi: 10.3390/jcm11185326. J Clin Med. 2022. PMID: 36142973 Free PMC article. Review. - NADPH oxidase deficiency underlies dysfunction of aged CD8+ Tregs.
Wen Z, Shimojima Y, Shirai T, Li Y, Ju J, Yang Z, Tian L, Goronzy JJ, Weyand CM. Wen Z, et al. J Clin Invest. 2016 May 2;126(5):1953-67. doi: 10.1172/JCI84181. Epub 2016 Apr 18. J Clin Invest. 2016. PMID: 27088800 Free PMC article.
References
Publication types
MeSH terms
Substances
Grants and funding
- P20GM103501/GM/NIGMS NIH HHS/United States
- R01 AI112402/AI/NIAID NIH HHS/United States
- NIH-R21CA162133/CA/NCI NIH HHS/United States
- P20 RR021970/RR/NCRR NIH HHS/United States
- R21 CA162133/CA/NCI NIH HHS/United States
- P20 GM103501/GM/NIGMS NIH HHS/United States
LinkOut - more resources
Full Text Sources
Other Literature Sources


