High-throughput genome scaffolding from in vivo DNA interaction frequency - PubMed (original) (raw)
. 2013 Dec;31(12):1143-7.
doi: 10.1038/nbt.2768. Epub 2013 Nov 24.
Affiliations
- PMID: 24270850
- PMCID: PMC3880131
- DOI: 10.1038/nbt.2768
High-throughput genome scaffolding from in vivo DNA interaction frequency
Noam Kaplan et al. Nat Biotechnol. 2013 Dec.
Abstract
Despite advances in DNA sequencing technology, assembly of complex genomes remains a major challenge, particularly for genomes sequenced using short reads, which yield highly fragmented assemblies. Here we show that genome-wide in vivo chromatin interaction frequency data, which are measurable with chromosome conformation capture-based experiments, can be used as genomic distance proxies to accurately position individual contigs without requiring any sequence overlap. We also use these data to construct approximate genome scaffolds de novo. Applying our approach to incomplete regions of the human genome, we predict the positions of 65 previously unplaced contigs, in agreement with alternative methods in 26/31 cases attempted in common. Our approach can theoretically bridge any gap size and should be applicable to any species for which global chromatin interaction data can be generated.
Figures
Figure 1
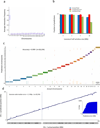
Interaction frequency accurately predicts chromosome and locus for scaffold augmentation. (a) Average interaction frequency strongly separates interchromosomal from intrachromosomal interactions. For each 100kb contig in chromosome 1, we calculate its average interaction frequency with each chromosome. We exclude interaction data from the contig’s 1 Mb regions on each side, where the strongest interaction frequencies are typically found. The box plot shows the distribution of average interaction frequencies of all contigs over all chromosomes and demonstrates that the distribution of interchromosomal interaction frequencies is separated from intrachromsomal interaction frequencies. Whiskers represent minimal and maximal points within 1.5 of the interquartile range. (b) Naïve Bayes predictive performance at various gap sizes. We trained a Naïve Bayes classifier and predicted the chromosome of each contig, leaving out a 1/2/5/10 Mb flanking region on each side of the contig. The accuracy of all cross-validated predictions and of the confident predictions is shown by the left y-axis and the blue and red lines, respectively. The fraction of total predictions that are confident is shown by the right y-axis and the black line. (c) Genome-wide view of Naïve Bayes predictive performance. The prediction for each contig is marked by a short vertical line, colored according to its true chromosome. Predictions showed were performed leaving out a 1 Mb flanking region on each side of the contig. Predictions that did not pass the confidence threshold are marked as “NC”. (d) Interaction frequencies accurately predict chromosomal locus. For every contig, we exclude interaction data from the contig’s 1Mb flanking regions on each side and then predict its location in cross-validation. The inset shows the cumulative distribution of the absolute prediction error. All statistics are genome-wide.
Figure 2
Scaffold augmentation of the human genome. (a) Interaction frequency data of an unplaced contig with its predicted chromosome. Green bar marks the predicted contig position. (b) Predicted positions of unplaced contigs. Vertical lines indicate contigs. Green and red colors indicate agreement and disagreement with previous predictions. Black: newly placed contigs with no previous predictions.
Figure 3
De novo karyotyping (chromosome assignment). We retained every tenth 100 kb contig in the genome, leaving 0.9 Mb gaps between contigs. We then transformed the interaction frequencies into approximate distances and applied standard average linkage hierarchical clustering to the approximate distance matrix, without using any prior knowledge regarding the positions of the contigs. The cluster assignment for each contig is marked by a short vertical line, colored according to its true chromosome.
Figure 4
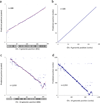
Accurate de novo chromosome scaffolding with interaction frequencies. (a, b) We retained every 10th 100 kb contig in the genome, leaving 0.9 Mb gaps between contigs. We then estimated the positions of all contigs, without using any prior knowledge regarding their positions. We arbitrarily scaled the predicted positions to the interval [0,1]. Note that the slope, which reflects scaling and orientation, is arbitrary. (a) Scaled predicted contig positions versus actual contig positions on chromosome 4. (b) Ranks of predicted contig positions versus rank of actual contig positions. (c, d) De novo scaffolding applied to a real set of contigs from chromosome 14 (see Methods). (c) Shown are the scaled predicted contig positions versus actual contig positions. (d) Ranks of predicted contig positions versus rank of actual contig positions.
Comment in
- Genome assembly and haplotyping with Hi-C.
Korbel JO, Lee C. Korbel JO, et al. Nat Biotechnol. 2013 Dec;31(12):1099-101. doi: 10.1038/nbt.2764. Nat Biotechnol. 2013. PMID: 24316648 No abstract available. - Genomes in 3D improve one-dimensional assemblies.
Rusk N. Rusk N. Nat Methods. 2014 Jan;11(1):5. doi: 10.1038/nmeth.2795. Nat Methods. 2014. PMID: 24524125 No abstract available.
Similar articles
- Genomes in 3D improve one-dimensional assemblies.
Rusk N. Rusk N. Nat Methods. 2014 Jan;11(1):5. doi: 10.1038/nmeth.2795. Nat Methods. 2014. PMID: 24524125 No abstract available. - Genome assembly and haplotyping with Hi-C.
Korbel JO, Lee C. Korbel JO, et al. Nat Biotechnol. 2013 Dec;31(12):1099-101. doi: 10.1038/nbt.2764. Nat Biotechnol. 2013. PMID: 24316648 No abstract available. - SLIQ: simple linear inequalities for efficient contig scaffolding.
Roy RS, Chen KC, Sengupta AM, Schliep A. Roy RS, et al. J Comput Biol. 2012 Oct;19(10):1162-75. doi: 10.1089/cmb.2011.0263. J Comput Biol. 2012. PMID: 23057825 - Assembly of chromosome-scale contigs by efficiently resolving repetitive sequences with long reads.
Du H, Liang C. Du H, et al. Nat Commun. 2019 Nov 25;10(1):5360. doi: 10.1038/s41467-019-13355-3. Nat Commun. 2019. PMID: 31767853 Free PMC article. - A comprehensive review of scaffolding methods in genome assembly.
Luo J, Wei Y, Lyu M, Wu Z, Liu X, Luo H, Yan C. Luo J, et al. Brief Bioinform. 2021 Sep 2;22(5):bbab033. doi: 10.1093/bib/bbab033. Brief Bioinform. 2021. PMID: 33634311 Review.
Cited by
- Whole genome sequencing of Clarireedia aff. paspali reveals potential pathogenesis factors in Clarireedia species, causal agents of dollar spot in turfgrass.
Bahri BA, Parvathaneni RK, Spratling WT, Saxena H, Sapkota S, Raymer PL, Martinez-Espinoza AD. Bahri BA, et al. Front Genet. 2023 Jan 5;13:1033437. doi: 10.3389/fgene.2022.1033437. eCollection 2022. Front Genet. 2023. PMID: 36685867 Free PMC article. - De novo chromosome level assembly of a plant genome from long read sequence data.
Sharma P, Masouleh AK, Topp B, Furtado A, Henry RJ. Sharma P, et al. Plant J. 2022 Feb;109(3):727-736. doi: 10.1111/tpj.15583. Epub 2021 Dec 2. Plant J. 2022. PMID: 34784084 Free PMC article. - HIPPIE2: a method for fine-scale identification of physically interacting chromatin regions.
Kuksa PP, Amlie-Wolf A, Hwang YC, Valladares O, Gregory BD, Wang LS. Kuksa PP, et al. NAR Genom Bioinform. 2020 Jun;2(2):lqaa022. doi: 10.1093/nargab/lqaa022. Epub 2020 Mar 31. NAR Genom Bioinform. 2020. PMID: 32270138 Free PMC article. - Decoding the role of chromatin architecture in development: coming closer to the end of the tunnel.
Luo C, Dong J, Zhang Y, Lam E. Luo C, et al. Front Plant Sci. 2014 Aug 21;5:374. doi: 10.3389/fpls.2014.00374. eCollection 2014. Front Plant Sci. 2014. PMID: 25191327 Free PMC article. Review. - The giant axolotl genome uncovers the evolution, scaling, and transcriptional control of complex gene loci.
Schloissnig S, Kawaguchi A, Nowoshilow S, Falcon F, Otsuki L, Tardivo P, Timoshevskaya N, Keinath MC, Smith JJ, Voss SR, Tanaka EM. Schloissnig S, et al. Proc Natl Acad Sci U S A. 2021 Apr 13;118(15):e2017176118. doi: 10.1073/pnas.2017176118. Proc Natl Acad Sci U S A. 2021. PMID: 33827918 Free PMC article.
References
- Nagarajan N, Pop M. Sequence assembly demystified. Nat. Rev. Genet. 2013;14:157–167. - PubMed
- Birney E. Assemblies: the good, the bad, the ugly. Nat. Methods. 2011;8:59–60. - PubMed
- Baker M. De novo genome assembly: what every biologist should know. Nat. Methods. 2012;9:333–337.
Publication types
MeSH terms
Substances
LinkOut - more resources
Full Text Sources
Other Literature Sources
Miscellaneous


