IFNγ-stimulated dendritic cell exosomes as a potential therapeutic for remyelination - PubMed (original) (raw)
IFNγ-stimulated dendritic cell exosomes as a potential therapeutic for remyelination
Aya D Pusic et al. J Neuroimmunol. 2014.
Abstract
Dendritic cells (DCs) release exosomes with different characteristics based on stimulus. Here, we showed that DC cultures stimulated with low-level IFNγ released exosomes (IFNγ-DC-Exos) that contained microRNA species that can increase baseline myelination, reduce oxidative stress, and improve remyelination following acute lysolecithin-induced demyelination. Furthermore, nasally administered IFNγ-DC-Exos increased CNS myelination in vivo. IFNγ-DC-Exos were preferentially taken up by oligodendrocytes, suggesting that they directly impact oligodendrocytes to increase myelination. Thus, our results show great potential for use of these IFNγ-DC-Exos as a therapeutic to promote remyelination in multiple sclerosis and dysmyelinating syndromes.
Keywords: Demyelination; Dendritic cell; Exosomes; MicroRNA; Multiple sclerosis; Myelin.
Copyright © 2013 Elsevier B.V. All rights reserved.
Figures
Figure 1. IFNγ-stimulated dendritic cells produced non-toxic exosomes
Exosome isolation confirmed by (A) Immunoblot for surface markers CD63 and Alix, and by (B) electron microscopy. Scale bar, 50 nm. (C) Exosome application to slice cultures showed no toxic effects. Slices were stained with Sytox™ at 3, 6, 9, and 12 days post-treatment. NeuN immunostaining image (left) shows normal neuronal architecture. Dotted lines indicate pyramidal (large arc) and dentate gyrus (small arc) principal neuronal layers. Sytox™ positive image (center) shows a control with principal neuronal injury induced by 24 hour exposure to 20 μM N-methyl-d-aspartate. Sytox™ negative image (right) of exosome treated culture showed no injury. Images were inverted to enhance visualization. Scale bar, 250 μm. (D) Quantification of Sytox™ fluorescence intensity (n = 9 slices/group) confirmed no significant change (ANOVA plus post hoc Holm-Sidak testing).
Figure 2. IFNγ-stimulated-DC-Exos increased myelination in slice culture
(A) Representative electron microscopy images illustrate increased compact myelin in IFNγ-DC-Exo treated slice cultures. Treatments from left to right: control (no treatment); IFNγ-DC-Exo; UV-IFNγ-DC-Exo; and unstimulated-DC-Exo. Scale bar, 200 nm. (B) Quantification of myelin g ratios from electron microscopy images (n = 3 slices/group; and 10 cells/slice) showed a significant (*, p = 0.008) increase in compact myelin thickness with IFNγ-DC-Exo treatment. (C) Immunoblot confirmation of myelin basic protein (MBP) showed bands at 18, 23, and 45kDa representing three transcripts of MBP. A quantification of all three transcripts of MBP showed a significant (*, p = 0.02) increase in MBP levels in slice cultures treated with IFNγ-DC-Exos and a significant (#, p = <0.001; n = 9, 15, 11, 9 slices/group, respectively) decrease in MBP in slice cultures treated with UV-IFNγ-DC-Exo. Significance was determined by ANOVA plus post hoc Holm-Sidak testing and ANOVA testing.
Figure 3. Progenitor cell populations were not affected by IFNγ-stimulated-DC-Exo treatments
Confocal typical images are shown for (A) neural stem cells (Musashi; red) with DAPI counterstaining (blue) and for (B) oligodendrocyte progenitor cells (NG2; green) in control untreated slice cultures (left panel), IFNγ-stimulated-DC-Exos treated slice cultures (middle panel), and unstimulated-DC-Exos treated slice cultures (right panel). DAPI was used with Musashi staining to enhance determination of cell number since Musashi is a cytoplasmic marker. In contrast, NG2 alone was sufficient to determine cell numbers. Scale bar, 10 μm. Quantification of the number of positive (C) neural stem cells and (D) oligodendrocyte progenitor cells in each treatment group (determined from 9 images/group and n = 3/group). No significant differences were seen between groups via ANOVA plus post hoc Holm-Sidak testing.
Figure 4. IFNγ-stimulated-DC-Exos reduced oxidative stress in slice culture
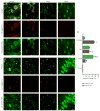
(A) Representative images show oxidative stress induced by acute exposure to menadione measured via CellROX™, a fluorescent marker of oxidative stress after exposure to menadione alone (control, left) and after treatment with IFNγ-stimulated-DC-Exos (middle) and unstimulated-DC-Exos (right). Scale bar, 200 μm. Quantification of fluorescence intensity (B) was performed at the CA3 area and showed that IFNγ-stimulated-DC-Exo treatment significantly (*, p < 0.001; n = 8/group) reduced oxidative stress relative to control and unstimulated-DC-Exo treatment. (C) Representative images show glutathione (ThiolTracker™) and microglia (Iso-lectinB4) costaining. Control (left), IFNγ-stimulated-DC-Exos (middle) and unstimulated-DC-Exos (right). (D) Quantification of ThiolTracker™ fluorescence intensity revealed a significant (*, p < 0.001; n = 9) increase in glutathione content of microglia after treatment with IFNγ-stimulated-DC-Exos and unstimulated-DC-Exos compared to control. Microglial glutathione content after IFNγ-stimulated-DC-Exo treatment was also significantly (#, p < 0.001; n = 9) increased relative to unstimulated-DC-Exo treatment. Significance was determined by ANOVA plus post hoc Holm-Sidak testing.
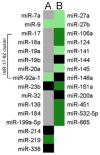
Figure 5. IFNγ-stimulated-DC-Exo were enriched in miRNA species involved in myelin production and anti-inflammatory response
miRNA content of IFNγ-stimulated-DC-Exos were compared to that of unstimulated-DC-Exos. Results show expression levels of specific miRNAs involved in (A) myelin production/oligodendrocyte differentiation and (B) anti-inflammatory response. Black panels indicate mature miRNA species that could not be detected; grey panels indicate miRNAs that were readily detectible but not significantly enriched; light green indicate significantly enriched (i.e., >2 fold) miRNAs; and dark green indicates very highly enriched (i.e., >10 fold) miRNAs. Complete screening results are presented in Supplementary Materials.
Figure 6. IFNγ-stimulated-DC-Exos deliver functional miR-219
Slice cultures were treated with IFNγ-stimulated-DC-Exos and immunoblots performed on extracted protein to determine levels of (A) PDGFRα and (B) ELOVL7, compared to untreated controls. IFNγ-stimulated-DC-Exo treatment significantly (*, p < 0.001; n = 3 slices/group) decreased PDGFRα protein levels. Similarly, IFNγ-stimulated-DC-Exo treatment significantly (*, p < 0.001; n = 3 slices/group) decreased levels of ELOVL7 protein in slice cultures.
Figure 7. IFNγ-stimulated-DC-Exos increased remyelination after acute lysolecithin induced demyelination
Slice cultures were exposed to lysolecithin to model acute demyelination followed by remyelination, then given different exosome treatments. At five days post-treatment, at the onset of remyelination, cultures were harvested and myelin basic protein (MBP) content quantified via immunoblot. While lysolecithin (Lyso) exposure caused a significant (*, p < 0.001; n = 9 slices/group) reduction of MBP in all groups compared to control, treatment with IFNγ-stimulated-DC-Exos induced a significant (#, p < 0.001) increase in remyelination compared to all other lysolecithin exposed groups. Significance was determined by ANOVA plus post hoc Holm-Sidak testing.
Figure 8. Nasal administration of IFNγ-stimulated-DC-Exos increased production of myelin in neocortex
(A) Three days after nasally administered phosphate buffered saline-sham (left) or IFNγ-stimulated-DC-Exos (right), brains were harvested, frozen, and cortex sectioned for staining with FluoroMyelin™ to measure myelin levels and (B) MBP immunostaining. Scale bar, 100 μm. Quantification showed a significant (*, p < 0.001; n = 3 animals/group) increase in (C) FluoroMyelin™ staining intensity and a significant (*, p = 0.011; n = 3 animals/group) increase in (D) MBP immunostaining intensity following nasal administration of IFNγ-stimulated-DC-Exos. (E) Immunoblot for MBP shows a significant (*, p = 0.019; n = 3 animals/group) increase in MBP levels in the parasagittal motor cortex area of animals treated with IFNγ-stimulated-DC-Exos. Motor cortex was chosen as a representative area of brain. Significance was determined by Student’s _t_-test.
Figure 9. Confirmation of exosome QD tagging
(A) Agarose gel electrophoresis of CD63-conjugated QD nanoparticles (Lane 1) and unconjugated QD nanoparticles (Lane 2). Gel is oriented with the cathode at the top and the anode at the bottom. (B) Electron microscopy image of QD nanoparticle (arrowhead) tagged to exosomes (arrow). Scale bar, 25 nm.
Figure 10. IFNγ-stimulated-DC-Exos preferentially enter oligodentrocytes
(A) Merged images (top row) of QD tagged IFNγ-stimulated-DC-Exos (middle row, red) and cell-specific immunofluorescence (bottom row, green). (B) Merged images (top row) of QD tagged unstimulated-DC-Exos (middle row, red) and cell-specific immunofluorescence (bottom row, green). Left to right oligodendroctyes (anti-CNPase), microglia (anti-Iba-1), astrocytes (anti-GFAP), and neurons (anti-NeuN). Scale bars (A and B), 10 μm. (C) Uptake of QD tagged IFNγ-stimulated-DC-Exos and QD tagged unstimulated-DC-Exos for each cell type. Percent uptake calculated per 60 cells from n = 3 slices/group. These results indicate that DC exosomes can track to specific brain cell types. IFNγ-stimulated-DC-Exos were significantly (*, p < 0.001) localized to oligodendrocytes, while unstimulated-DC-Exos were significantly (*, p < 0.001) localized to astrocytes. Significance was determined by Student’s _t_-test.
Figure 11. miR-219 mimic and IFNγ-stimulated-DC-Exos similarly promote OPC differentiation
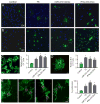
(A) Representative images of O4 positive staining with DAPI counterstain used for quantification. (B) Representative images of O1 positive staining with DAPI counterstain used for quantification. Scale bars (A and B), 20 μm. (C) Representative high-power image of O4 staining to illustrate morphology, and quantification of percent of O4 positive cells (O4+ cells/total DAPI+ cells) per field (3 images per coverslip, n = 3 coverslips/group). Scale bar, 10 μm. Treatment with miR-219 mimic and IFNγ-stimulated-DC-Exos stimulated differentiation of OPCs into O4 expressing cells similar to T3 supplementation, and all groups were significantly (*, p < 0.001) increased from control. (D) Representative high-powered image of O1 positive staining and quantification of percent of O1 positive cells (O1+ cells/total DAPI+ cells) per field (3 images per coverslip, n = 3 coverslips/group). Scale bar, 10 μm. Treatment with miR-219 mimic and IFNγ-stimulated-DC-Exos stimulated differentiation of OPCs into mature O1 expressing cells similar to T3 supplementation, and all groups were significantly (*, p = 0.002) increased from control. (E) Representative images of O4 and Ki-67 positive staining of OPCs given different treatments. From left to right: control, T3, miR-219 mimic, and IFNγ-stimulated-DC-Exos treatments. Quantification of percent O4/Ki-67 double positive cells per field (3 images per coverslip, n = 3 coverslips/group) shows that treatment with miR-219 mimic and IFNγ-stimulated-DC-Exos increased OPC proliferation similar to T3 supplementation, all groups were significantly (*, p < 0.001) increased compared to control. Scale bar, 10 μm.
Similar articles
- IFNγ-stimulated dendritic cell extracellular vesicles can be nasally administered to the brain and enter oligodendrocytes.
Pusic KM, Kraig RP, Pusic AD. Pusic KM, et al. PLoS One. 2021 Aug 13;16(8):e0255778. doi: 10.1371/journal.pone.0255778. eCollection 2021. PLoS One. 2021. PMID: 34388189 Free PMC article. - Fingolimod (FTY720) enhances remyelination following demyelination of organotypic cerebellar slices.
Miron VE, Ludwin SK, Darlington PJ, Jarjour AA, Soliven B, Kennedy TE, Antel JP. Miron VE, et al. Am J Pathol. 2010 Jun;176(6):2682-94. doi: 10.2353/ajpath.2010.091234. Epub 2010 Apr 22. Am J Pathol. 2010. PMID: 20413685 Free PMC article. - Galectin-1 circumvents lysolecithin-induced demyelination through the modulation of microglial polarization/phagocytosis and oligodendroglial differentiation.
Rinaldi M, Thomas L, Mathieu P, Carabias P, Troncoso MF, Pasquini JM, Rabinovich GA, Pasquini LA. Rinaldi M, et al. Neurobiol Dis. 2016 Dec;96:127-143. doi: 10.1016/j.nbd.2016.09.003. Epub 2016 Sep 6. Neurobiol Dis. 2016. PMID: 27612409 - The role of oligodendrocytes and oligodendrocyte progenitors in CNS remyelination.
Keirstead HS, Blakemore WF. Keirstead HS, et al. Adv Exp Med Biol. 1999;468:183-97. doi: 10.1007/978-1-4615-4685-6_15. Adv Exp Med Biol. 1999. PMID: 10635029 Review. - Models for Studying Myelination, Demyelination and Remyelination.
Osorio-Querejeta I, Sáenz-Cuesta M, Muñoz-Culla M, Otaegui D. Osorio-Querejeta I, et al. Neuromolecular Med. 2017 Sep;19(2-3):181-192. doi: 10.1007/s12017-017-8442-1. Epub 2017 May 23. Neuromolecular Med. 2017. PMID: 28536996 Review.
Cited by
- The role of the immune system and the biomarker CD3 + CD4 + CD45RA-CD62L- in the pathophysiology of migraine.
Pavelek Z, Souček O, Krejsek J, Sobíšek L, Klímová B, Masopust J, Kuča K, Vališ M. Pavelek Z, et al. Sci Rep. 2020 Jul 23;10(1):12277. doi: 10.1038/s41598-020-69285-4. Sci Rep. 2020. PMID: 32704149 Free PMC article. - Methodologies to Isolate and Purify Clinical Grade Extracellular Vesicles for Medical Applications.
Akbar A, Malekian F, Baghban N, Kodam SP, Ullah M. Akbar A, et al. Cells. 2022 Jan 6;11(2):186. doi: 10.3390/cells11020186. Cells. 2022. PMID: 35053301 Free PMC article. Review. - Potential functional applications of extracellular vesicles: a report by the NIH Common Fund Extracellular RNA Communication Consortium.
Quesenberry PJ, Aliotta J, Camussi G, Abdel-Mageed AB, Wen S, Goldberg L, Zhang HG, Tetta C, Franklin J, Coffey RJ, Danielson K, Subramanya V, Ghiran I, Das S, Chen CC, Pusic KM, Pusic AD, Chatterjee D, Kraig RP, Balaj L, Dooner M. Quesenberry PJ, et al. J Extracell Vesicles. 2015 Aug 28;4:27575. doi: 10.3402/jev.v4.27575. eCollection 2015. J Extracell Vesicles. 2015. PMID: 26320942 Free PMC article. - Molecular Biomarkers in Multiple Sclerosis and Its Related Disorders: A Critical Review.
Gul M, Jafari AA, Shah M, Mirmoeeni S, Haider SU, Moinuddin S, Chaudhry A. Gul M, et al. Int J Mol Sci. 2020 Aug 21;21(17):6020. doi: 10.3390/ijms21176020. Int J Mol Sci. 2020. PMID: 32825639 Free PMC article. Review. - Recent Advances in the Application of Mesenchymal Stem Cell-Derived Exosomes for Cardiovascular and Neurodegenerative Disease Therapies.
Yang Z, Li Y, Wang Z. Yang Z, et al. Pharmaceutics. 2022 Mar 11;14(3):618. doi: 10.3390/pharmaceutics14030618. Pharmaceutics. 2022. PMID: 35335993 Free PMC article. Review.
References
- Birgbauer E, Rao TS, Webb M. Lysolecithin induces demyelination in vitro in a cerebellar slice culture system. J Neurosci Res. 2004;78:157–166. - PubMed
- Bobrie A, Colombo M, Raposo G, Thery C. Exosome secretion: molecular mechanisms and roles in immune responses. Traffic. 2011;12:1659–1668. - PubMed
- Budde H, Schmitt S, Fitzner D, Opitz L, Salinas-Riester G, Simons M. Control of oligodendroglial cell number by the miR-17-92 cluster. Development. 2010;137:2127–2132. - PubMed
Publication types
MeSH terms
Substances
Grants and funding
- UL1 TR000430/TR/NCATS NIH HHS/United States
- UL1TR000430/TR/NCATS NIH HHS/United States
- R01 NS019108/NS/NINDS NIH HHS/United States
- 5 PO1 HD 09402/HD/NICHD NIH HHS/United States
- NS-19108/NS/NINDS NIH HHS/United States
- T32 GM007839/GM/NIGMS NIH HHS/United States
- 5T32GM007839-31/GM/NIGMS NIH HHS/United States
- 1 UH 2 TR000918/TR/NCATS NIH HHS/United States
- P01 HD009402/HD/NICHD NIH HHS/United States
- UH2 TR000918/TR/NCATS NIH HHS/United States
LinkOut - more resources
Full Text Sources
Other Literature Sources


