Identification of Insulin-Like Growth Factor-I Receptor (IGF-IR) Gene Promoter-Binding Proteins in Estrogen Receptor (ER)-Positive and ER-Depleted Breast Cancer Cells - PubMed (original) (raw)
Identification of Insulin-Like Growth Factor-I Receptor (IGF-IR) Gene Promoter-Binding Proteins in Estrogen Receptor (ER)-Positive and ER-Depleted Breast Cancer Cells
Rive Sarfstein et al. Cancers (Basel). 2010.
Abstract
The insulin-like growth factor I receptor (IGF-IR) has been implicated in the etiology of breast cancer. Overexpression of the IGF-IR gene is a typical feature of most primary breast cancers, whereas low IGF-IR levels are seen at advanced stages. Hence, evaluation of IGF-IR levels might be important for assessing prognosis. In the present study, we employed a proteomic approach based on DNA affinity chromatography followed either by mass spectroscopy (MS) or Western blot analysis to identify transcription factors that may associate with the IGF-IR promoter in estrogen receptor (ER)-positive and ER-depleted breast cancer cells. A biotinylated IGF-IR promoter fragment was bound to streptavidin magnetic beads and incubated with nuclear extracts of breast cancer cells. IGF-IR promoter-binding proteins were eluted with high salt and analyzed by MS and Western blots. Among the proteins that were found to bind to the IGF-IR promoter we identified zinc finger transcription factors Sp1 and KLF6, ER-, p53, c-jun, and poly (ADP-ribosylation) polymerase. Furthermore, chromatin immune-precipitation (ChIP) analysis confirmed the direct in vivo binding of some of these transcription factors to IGF-IR promoter DNA. The functional relevance of binding data was assessed by cotransfection experiments with specific expression vectors along with an IGF-IR promoter reporter. In summary, we identified nuclear proteins that are potentially responsible for the differential expression of the IGF-IR gene in ER-positive and ER-depleted breast cancer cells.
Figures
Figure 1
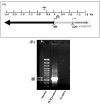
IGF-IR promoter. (A) Schematic representation of the IGF-IR promoter region [5]. The initiator (INR) element is denoted by an arrow. The coding region, starting with the AUG codon, is shown in gray. The translation start site is denoted by a dashed arrow. The 5’-flanking region is denoted by a black bar, and the 5’-untranslated region (UTR) is represented by a dotted bar. The location of primers (P#1 and P#2), employed to amplify the proximal promoter is indicated. (B) PCR amplification of the human IGF-IR promoter. The PCR reaction was performed using a biotinylated antisense primer, as described under Materials and Methods section, and 4 μL of the biotinylated PCR product was loaded on a 1% agarose gel. A PCR reaction without DNA served as negative control. A 100-bp DNA ladder was used as a M.W. marker.
Figure 2
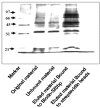
Silver staining of IGF-IR promoter-bound proteins identified by DNA affinity chromatography. Nuclear extracts of MCF7 cells were prepared as described under Materials and Methods Section. Proteins bound to IGF-IR promoter DNA (10 μg) were electrophoresed through 10% SDS-PAGE, fixed, and stained with silver (Bio-Rad, Hercules, CA, USA). Lane 1, M.W. marker; lane 2, starting material (MCF7 nuclear extract, 4.2 μg); lane 3, unbound material (MCF7 nuclear extract that did not bind to DNA, 4.2 μg); lane 4, eluted material bound to Biotin-520 bp (MCF7 nuclear proteins that bound to IGF-IR promoter, 10 μg); and lane 5, negative control (MCF7 nuclear proteins bound to strepavidin magnetic beads, 10 μg).
Figure 3
IGF-IR and ERα expression in MCF7 and C4.12.5 breast cancer cell lines.MCF7 and C4.12.5 cells were lysed as described under Materials and Methods. Cellular extracts (80 μg) were electrophoresed through 10% SDS-PAGE, transferred to nitrocellulose membranes, and blotted with anti-total IGF-IR-β, anti-pIGF-IR, and anti-ERα. Blots were then blotted with a tubulin antibody as a loading control.
Figure 4
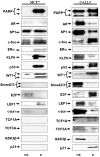
IGF-IR promoter-binding transcription factors identified by Western blots in the MCF7 and C4.12.5 cell lines. DNA chromatography eluates were electrophoresed though 10% SDS-PAGE and blotted with the antibodies listed under Materials and Methods Section. The left lanes correspond to nuclear extracts (NE; 4.2 μg) and the right lanes correspond to DNA affinity chromatography eluates (E; 10 μg).
Figure 5
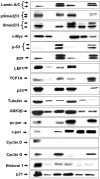
Cellular distribution of transcription factors in the MCF7 and C4.12.5 cell lines. Cell lines were fractionated as described under Materials and Methods and total lysates (T; 80 μg), cytosolic fractions (C; 20 μg), and nuclear extracts (N; 20 μg) were resolved on 10% SDS-PAGE and blotted with the indicated antibodies.
Figure 6
ChIP assays of transcription factor binding to IGF-IR promoter DNA. (A). MCF7 cells were cross-linked with formaldehyde, lysed, sonicated, and immunoprecipitated with PARP, c-jun, Sp1, or KLF6 antibodies, or normal mouse or rabbit sera, followed by PCR amplification of precipitated chromatin using primers encompassing the IGF-IR promoter. The position of the 773 bp-amplified fragments is indicated. The input bands represent the amplified PCR product in the absence of antibodies. The insets indicate the endogenous levels of expression of the various proteins as measured by Western blots (WB) with specific antibodies or NRS or NMS as negative controls. IP, immunoprecipitation. (B). MCF7 cells were transfected with an expression vector encoding HA-HMGA1 (or empty pcDNA3 vector), after which the cells were cross linked with formaldehyde, lysed, sonicated and immunoprecipitated with an HA antibody, followed by PCR amplification of IGF-IR promoter DNA. HA-HMGA1 immunoprecipitated protein was detected by Western blots using an anti-HA antibody (inset).
Figure 7
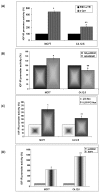
Regulation of IGF-IR promoter activity by c-jun, HMGA1, KLF6 or E2F1. MCF7 and C4.12.5 cells were cotransfected with the p(−476/+640)LUC reporter construct along with c-jun (A), HMGA1 (B), KLF6 (C) or E2F1(D) expression plasmids (or empty expression vectors). Forty eight hours after transfection the cells were harvested and luciferase activity was measured. Promoter activities are expressed as luciferase values normalized to protein concentration. A value of 100% was given to the promoter activity generated by the reporter plasmid in empty vector-transfected MCF-7 or C4.12.5 cells. The results represent the mean ± SEM (N = 3 independent experiments in triplicate wells); *p < 0.01 versus empty vector-tranfected cells and ∗∗ p < 0.01 versus specific vector-transfected MCF7 cells.
Similar articles
- Estrogen receptor regulates insulin-like growth factor-I receptor gene expression in breast tumor cells: involvement of transcription factor Sp1.
Maor S, Mayer D, Yarden RI, Lee AV, Sarfstein R, Werner H, Papa MZ. Maor S, et al. J Endocrinol. 2006 Dec;191(3):605-12. doi: 10.1677/joe.1.07016. J Endocrinol. 2006. PMID: 17170218 - Insulin-like growth factor-I receptor (IGF-IR) translocates to nucleus and autoregulates IGF-IR gene expression in breast cancer cells.
Sarfstein R, Pasmanik-Chor M, Yeheskel A, Edry L, Shomron N, Warman N, Wertheimer E, Maor S, Shochat L, Werner H. Sarfstein R, et al. J Biol Chem. 2012 Jan 20;287(4):2766-76. doi: 10.1074/jbc.M111.281782. Epub 2011 Nov 29. J Biol Chem. 2012. PMID: 22128190 Free PMC article. - The WT1 Wilms' tumor suppressor gene product interacts with estrogen receptor-alpha and regulates IGF-I receptor gene transcription in breast cancer cells.
Reizner N, Maor S, Sarfstein R, Abramovitch S, Welshons WV, Curran EM, Lee AV, Werner H. Reizner N, et al. J Mol Endocrinol. 2005 Aug;35(1):135-44. doi: 10.1677/jme.1.01761. J Mol Endocrinol. 2005. PMID: 16087727 - Function of the IGF-I receptor in breast cancer.
Surmacz E. Surmacz E. J Mammary Gland Biol Neoplasia. 2000 Jan;5(1):95-105. doi: 10.1023/a:1009523501499. J Mammary Gland Biol Neoplasia. 2000. PMID: 10791772 Review. - Type I insulin-like growth factor receptor function in breast cancer.
Surmacz E, Guvakova MA, Nolan MK, Nicosia RF, Sciacca L. Surmacz E, et al. Breast Cancer Res Treat. 1998 Feb;47(3):255-67. doi: 10.1023/a:1005907101686. Breast Cancer Res Treat. 1998. PMID: 9516080 Review.
Cited by
- The Role of ARID1A in the Nonestrogenic Modulation of IGF-1 Signaling.
Jdeed S, Erdős E, Bálint BL, Uray IP. Jdeed S, et al. Mol Cancer Res. 2022 Jul 6;20(7):1071-1082. doi: 10.1158/1541-7786.MCR-21-0961. Mol Cancer Res. 2022. PMID: 35320351 Free PMC article. - Antimetastatic Effects of Curcumin in Oral and Gastrointestinal Cancers.
Davoodvandi A, Farshadi M, Zare N, Akhlagh SA, Alipour Nosrani E, Mahjoubin-Tehran M, Kangari P, Sharafi SM, Khan H, Aschner M, Baniebrahimi G, Mirzaei H. Davoodvandi A, et al. Front Pharmacol. 2021 Aug 11;12:668567. doi: 10.3389/fphar.2021.668567. eCollection 2021. Front Pharmacol. 2021. PMID: 34456716 Free PMC article. Review. - 2021 update on thyroid-associated ophthalmopathy.
Neag EJ, Smith TJ. Neag EJ, et al. J Endocrinol Invest. 2022 Feb;45(2):235-259. doi: 10.1007/s40618-021-01663-9. Epub 2021 Aug 20. J Endocrinol Invest. 2022. PMID: 34417736 Free PMC article. Review. - The Role of Nuclear Insulin and IGF1 Receptors in Metabolism and Cancer.
Werner H, Sarfstein R, Laron Z. Werner H, et al. Biomolecules. 2021 Apr 2;11(4):531. doi: 10.3390/biom11040531. Biomolecules. 2021. PMID: 33918477 Free PMC article. Review. - Tumor suppressor p53 regulates insulin receptor (INSR) gene expression via direct binding to the INSR promoter.
Sarfstein R, Werner H. Sarfstein R, et al. Oncotarget. 2020 Jun 23;11(25):2424-2437. doi: 10.18632/oncotarget.27645. eCollection 2020 Jun 23. Oncotarget. 2020. PMID: 32637033 Free PMC article.
References
- Schnarr B., Strunz K., Ohsam J., Benner A., Wacker J., Mayer D. Down-regulation of insulin-like growth factor-I receptor and insulin receptor substrate-1 expression in advanced human breast cancer. Int. J. Cancer. 2000;89:506–513. doi: 10.1002/1097-0215(20001120)89:6<506::AID-IJC7>3.0.CO;2-F. - DOI - PubMed
- LeRoith D., Werner H., Beitner-Johnson D., Roberts C.T., Jr. Molecular and cellular aspects of the insulin-like growth factor I receptor. Endocr. Rev. 1995;16:143–163. - PubMed
LinkOut - more resources
Full Text Sources
Research Materials
Miscellaneous
