Isogenic human iPSC Parkinson's model shows nitrosative stress-induced dysfunction in MEF2-PGC1α transcription - PubMed (original) (raw)
. 2013 Dec 5;155(6):1351-64.
doi: 10.1016/j.cell.2013.11.009. Epub 2013 Nov 27.
Nima Dolatabadi, Shing Fai Chan, Xiaofei Zhang, Mohd Waseem Akhtar, James Parker, Frank Soldner, Carmen R Sunico, Saumya Nagar, Maria Talantova, Brian Lee, Kevin Lopez, Anthony Nutter, Bing Shan, Elena Molokanova, Yaoyang Zhang, Xuemei Han, Tomohiro Nakamura, Eliezer Masliah, John R Yates 3rd, Nobuki Nakanishi, Aleksander Y Andreyev, Shu-ichi Okamoto, Rudolf Jaenisch, Rajesh Ambasudhan, Stuart A Lipton
Affiliations
- PMID: 24290359
- PMCID: PMC4028128
- DOI: 10.1016/j.cell.2013.11.009
Isogenic human iPSC Parkinson's model shows nitrosative stress-induced dysfunction in MEF2-PGC1α transcription
Scott D Ryan et al. Cell. 2013.
Erratum in
- Cell. 2013 Dec 19;155(7):1652-3
Abstract
Parkinson's disease (PD) is characterized by loss of A9 dopaminergic (DA) neurons in the substantia nigra pars compacta (SNpc). An association has been reported between PD and exposure to mitochondrial toxins, including environmental pesticides paraquat, maneb, and rotenone. Here, using a robust, patient-derived stem cell model of PD allowing comparison of A53T α-synuclein (α-syn) mutant cells and isogenic mutation-corrected controls, we identify mitochondrial toxin-induced perturbations in A53T α-syn A9 DA neurons (hNs). We report a pathway whereby basal and toxin-induced nitrosative/oxidative stress results in S-nitrosylation of transcription factor MEF2C in A53T hNs compared to corrected controls. This redox reaction inhibits the MEF2C-PGC1α transcriptional network, contributing to mitochondrial dysfunction and apoptotic cell death. Our data provide mechanistic insight into gene-environmental interaction (GxE) in the pathogenesis of PD. Furthermore, using small-molecule high-throughput screening, we identify the MEF2C-PGC1α pathway as a therapeutic target to combat PD.
Copyright © 2013 Elsevier Inc. All rights reserved.
Figures
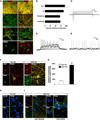
Figure 1. Characterization of hiPSC Differentiation into A9-type DA Neurons
(A) Micrographs of hiPSC differentiation into human DA neurons (hNs). NPCs (top) are both FOXA2/LMX1A double positive and OTX2/FOXA2 double positive at 11 days in vitro (DIV). Most β-III tubulin (TUJ1)+ neurons (lower-middle) stain for TH by DIV 25. TH+ neurons are also LMX1A+, NURR1+ (upper-middle) and GIRK2+ (bottom) at DIV 35. Blue, DAPI; scale bar, 50 µm. (B) Quantification of TUJ1, TH/TUJ1, TH/LMX1A, and TH/GIRK2-positive cells relative to total cell number. Data from replicate experiments at DIV 35 are shown as mean + SEM; n = 6. (C–E) Electrophysiological characterization of A53T hNs and corrected controls at DIV 35. INa and IK traces (n = 30, C). Cells were prepulsed to −90 mV for 150 ms and held at −60 mV with 10 mV voltage steps. Evoked action potential trains (Vh = −70 mV, n = 30, D). Spontaneous action potentials (n = 8, E). Mean resting potential, −39 ± 6 mV for A53T hN and −40 ± 3 mV (mean ± SEM) for corrected hN. Electrophysiological recordings were performed using K-gluconate internal solution. (F) α-synuclein costaining with thioflavin T in hiPSC-derived corrected (Corr) and A53T hNs. A53T mutant shows increased thioflavin T. DIV, 35; blue, DAPI; scale bar, 10 µm. (G) Quantification of thioflavin T fluorescence. Data from replicate experiments at DIV 35 shown as mean + SEM; n = 3. (H and I) Immunostaining of corrected hNs (H) and A53T mutant hNs (I) shows PS-129 colocalization with ubiquitin in neurites and cell bodies of A53T hNs (arrows). DIV, 35; blue, DAPI; scale bar, 10 µm. See also Figure S1 and Table S1.
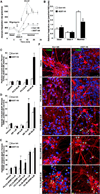
Figure 2. A53T Mutant hNs Are Highly Susceptible to Mitochondrial Toxin-Induced Apoptosis
(A and B) Mitochondrial O2 consumption monitored by Seahorse platform at DIV 35. After recording basal respiration, mitochondrial metabolic state 4 was induced with 1 µg/ml of the ATP synthase inhibitor oligomycin (Oligo), followed by induction of maximal respiration by the mitochondrial uncoupler FCCP in 1.5 µM increments. Maximal (Max) respiration was attained at a total FCCP concentration of 4.5 µM. Data from one of three replicate experiments are shown as mean ± SEM; n = 22 wells (A). Experimental data normalized to cell number per well (B). Neither basal respiration (reflecting cellular ATP demand) nor state 4 respiration (reflecting proton leak) differed between control and mutant cells. A53T mutant hNs displayed greatly reduced maximal respiratory capacity compared to corrected control. (C–E) A53T mutant hNs are more susceptible to apoptosis than their genetically corrected counterparts following exposure to PQ alone (C), MB alone (D), or combined exposure (E). Data represent mean + SEM. **p < 0.01 by ANOVA with posthoc Tukey; n = 6–12; DIV, 35. (F) Micrographs of TUNEL+ hNs following mitochondrial toxin exposure. DIV, 35; blue, DAPI; scale bar, 10 µm. See also Figure S2.
Figure 3. A53T Mutant hNs Manifest Altered Transcriptional Network Activity
(A) Expression profiling of A53T mutant and corrected (Corr) hNs at DIV 35. Genes whose expression was altered ≥ 2-fold (p < 0.05 significance) were clustered based upon functional correlation using GenePattern (Broad Institute), and the resulting heatmap is depicted (red, up; blue, down; data from three replicate experiments). A53T mutant hNs had a strikingly different genetic profile from corrected counterparts. (B–D) Pathway enrichment analysis was performed on all genes whose expression was altered (7,018 genes; p < 0.05 significance) in A53T hNs relative to corrected using NextBio and was filtered based on regulatory motifs using the Broad Institute Molecular Signatures Database (BroadMSigDB). Enrichment score was assigned by NextBio based on the method of Kupershmidt et al. (2010). Transcription factors were grouped based on their contribution to apoptosis (B), cell survival (C), or DA neuronal transcription (D). Transcription factor with the highest enrichment score was MEF2 (denoted in red). (Blue circle) Genes altered in A53T relative to corrected; (red circle) genes with transcription factor binding motifs within 2 kb of the transcriptional start site; (purple overlap) genes with transcription factor binding motifs within 2 kb of the transcriptional start site that are altered in A53T relative to corrected. See also Figure S3.
Figure 4. Accumulation of ROS/RNS in A53T hNs Aberrantly Modifies the Neuronal Prosurvival Transcription Factor MEF2C
(A) Representative micrographs of MitoSOX (red)-labeled A53T mutant and corrected hNs superimposed on phase-contrast images under basal conditions. DIV, 35; blue, DAPI; scale bar, 10 µm. (B) Quantification of superoxide anion accumulation at DIV 35 in corrected and A53T mutant hNs measured via MitoSOX labeling following pesticide exposure. A53T mutant hNs displayed increased labeling relative to corrected (Corr) at baseline and following exposure to 200 nM rotenone or 2.8 µMPQ/1 µM MB. Values are mean + SEM. **p < 0.01 by t test; n = 6. (C) Increased SOH-MEF2C detected at DIV 35 in A53T relative to corrected hNs after administration of mitochondrial toxins. SOH-protein capture using DCP-Bio1 and subsequent immunoblot for MEF2C show increased SOH-MEF2C upon exposure to H2O2 or PQ/MB. (D) Quantification of SOH-MEF2C. Values are mean + SEM. *p < 0.05 by ANOVA with posthoc Tukey; n = 3. (E and F) DAF-FM staining of NO levels shows higher basal values and more rapid accumulation of NO after pesticide exposure in A53T mutant relative to corrected hNs. (G) Time course of DAF-FM signal in A53T and corrected hNs following exposure to PQ/MB normalized to respective baseline levels. Inset shows that A53T mutant hNs have a 17% higher level of DAF-FM fluorescence than corrected hNs at baseline. (H)
l
-NAME pretreatment reduced both baseline and pesticide-evoked DAF-FM signal in A53T hNs. Pesticide exposure time, 6 hr; DIV, 35; blue, DAPI; scale bar, 10 µm. Data represent mean ± SEM. **p < 0.01 by two-way ANOVA with posthoc Tukey; n = 6. (I and J) Biotin switch at DIV 35 shows that A53T mutant hNs had substantial basal levels of SNO-MEF2C compared to corrected hNs, pesticides increased SNO-MEF2C levels (I), and
l
-NAME inhibited basal SNO-MEF2C formation with negative control in the absence of ascorbate (–Asc) (J). (K) Quantification of SNO-MEF2C. Values are mean + SEM. **p < 0.01, by ANOVA with posthoc Tukey; n = 3. See also Figure S4.
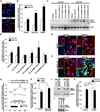
Figure 5. MEF2C-Mediated Transcriptional Activation Is Inhibited in A53T hNs
(A) Immunoblot analysis shows decreased TH and NURR1 protein expression in A53T mutant relative to corrected hNs at DIV 35. (B and C) qRT-PCR shows significant reduction in MAP2 and _PGC1_α mRNA in A53T mutant relative to corrected hNs at DIV 35. Data represent mean + SEM. **p < 0.01 by t test; n = 3. (D) Activation of native _PGC1_α promoter and _PGC1_α promoter lacking the MEF2-binding site (ΔMEF2) in A53T hNs relative to corrected hNs at DIV 35. Data represent mean + SEM. **p < 0.01 by t test; n = 4. (E) MEF2-driven _PGC1_α promoter activity inhibited in A53T hNs relative to corrected hNs at DIV 35.
l
-NAME prevented 50% of this inhibition. _PGC1_α promoter activity attributable to MEF2 was derived from the following formula using the data in (D): (1 − (ΔMEF2/_PGC1_α) × 100). Data represent mean + SEM. **p < 0.01 by t test; n = 4. (F) ChIP analysis on chromatin prepared from A53T mutant versus corrected (Corr) hNs at DIV 25 revealed 4-fold reduction in MEF2C bound to _PGC1_α promoter. Data represent mean + SEM. *p < 0.05 by t test; n = 3. (G)
l
-NAME increases MEF2C binding to _PGC1_α promoter by ~10-fold. Data represent mean + SEM. **p < 0.01 by t test; n = 3. (H) Effect of WT MEF2C or mutant MEF2C(C39A) on _PGC1_α promoter activity in the presence and absence of SNOC in A53T and corrected hNs at DIV 35. Data represent mean + SEM. *p < 0.05 by ANOVA with posthoc Tukey; n = 4. See also Figure S5.
Figure 6. MEF2C and Pesticides Regulate PGC1α Protein Expression In Vivo
(A) PGC1α protein expression in WT and A53T mutant mouse brain in the presence and absence of PQ/MB exposure. (B) PQ/MB increases SNO-MEF2C expression in WT mouse brain by biotin switch assay. (C) Quantification of SNO-MEF2C in WT mouse brain. Values are mean + SEM. **p < 0.01, by t test; n = 3. (D) PGC1α protein levels are reduced in MEF2C+/– and MEF2C conditional knockout mouse brains.
Figure 7. Activation of MEF2C Transcriptional Network Rescues A53T Mutant hNs from Mitochondrial Toxin-Evoked Death
(A)
l
-NAME partially blocks PQ/MB-induced death in A53T mutant hiPSC-derived hNs. **p < 0.01 by ANOVA with posthoc Tukey; n = 6. (B) TUNEL reactivity in A53T hNs exposed to mitochondrial toxins PQ and MB following overexpression of MEF2C (with or without 1 mM
l
-NAME) or PGC1α. WT MEF2C, mutant MEF2C(C39A), and PGC1α rescue from PQ/MB-induced apoptosis relative to empty vector (EV)-expressing cells. DIV, 25; blue, DAPI; scale bar, 10 µm. (C) Quantification of data in (C). Values are mean + SEM. **p < 0.01, *p < 0.05 by ANOVA with posthoc Tukey or Fisher PLSD; n = 6. (D) TUNEL reactivity in A53T hNs exposed to PQ and MB following pretreatment with the MEF2 activator Isoxazole (10 µM). Isoxazole rescued from rotenone- or PQ/MB-induced apoptosis. DIV, 35; blue, DAPI; scale bar, 10 µm. (E) Quantification of data in (D). Values are mean + SEM. *p < 0.05 by t test; n = 3. (F) In human A9-type DA neurons, MEF2C drives MEF2 target genes, including _PGC1_α expression, which in turn promotes mitochondrial biogenesis, mitochondrial respiration, and neuronal health (i). When SNCA is mutated (A53T) in familial PD, higher steady-state levels of RNS result in the S-nitrosylation of MEF2C under basal conditions. Resulting inhibition of MEF2C transcriptional activity decreases MEF2 target gene expression, including PGC1α (dashed line), with consequent impairment of mitochondrial respiration and disruption of neuronal function (ii). Combined effect of mitochondrial stress due to A53T SNCA and exposure to mitochondrial toxins produces a dramatic increase in RNS and ROS over basal conditions, resulting in increased S-nitrosylation and/or sulfonation of MEF2C and further decrease in MEF2C activity. The decreased MEF2C activity leads to further inhibition of MEF2 target gene transcription, including _PGC1_α, and consequently a more profound drop in mitochondrial biogenesis and respiration, culminating in neuronal cell death (width of red lines indicates magnitude of effect) (iii). See also Figure S6.
Similar articles
- Nitration of microtubules blocks axonal mitochondrial transport in a human pluripotent stem cell model of Parkinson's disease.
Stykel MG, Humphries K, Kirby MP, Czaniecki C, Wang T, Ryan T, Bamm V, Ryan SD. Stykel MG, et al. FASEB J. 2018 Oct;32(10):5350-5364. doi: 10.1096/fj.201700759RR. Epub 2018 Apr 24. FASEB J. 2018. PMID: 29688812 - Axonal pathology in hPSC-based models of Parkinson's disease results from loss of Nrf2 transcriptional activity at the Map1b gene locus.
Czaniecki C, Ryan T, Stykel MG, Drolet J, Heide J, Hallam R, Wood S, Coackley C, Sherriff K, Bailey CDC, Ryan SD. Czaniecki C, et al. Proc Natl Acad Sci U S A. 2019 Jul 9;116(28):14280-14289. doi: 10.1073/pnas.1900576116. Epub 2019 Jun 24. Proc Natl Acad Sci U S A. 2019. PMID: 31235589 Free PMC article. - Alpha-synuclein suppresses mitochondrial protease ClpP to trigger mitochondrial oxidative damage and neurotoxicity.
Hu D, Sun X, Liao X, Zhang X, Zarabi S, Schimmer A, Hong Y, Ford C, Luo Y, Qi X. Hu D, et al. Acta Neuropathol. 2019 Jun;137(6):939-960. doi: 10.1007/s00401-019-01993-2. Epub 2019 Mar 15. Acta Neuropathol. 2019. PMID: 30877431 Free PMC article. - Reprint of: revisiting oxidative stress and mitochondrial dysfunction in the pathogenesis of Parkinson disease-resemblance to the effect of amphetamine drugs of abuse.
Perfeito R, Cunha-Oliveira T, Rego AC. Perfeito R, et al. Free Radic Biol Med. 2013 Sep;62:186-201. doi: 10.1016/j.freeradbiomed.2013.05.042. Epub 2013 Jun 3. Free Radic Biol Med. 2013. PMID: 23743292 Review. - Cellular and Molecular Events Leading to Paraquat-Induced Apoptosis: Mechanistic Insights into Parkinson's Disease Pathophysiology.
See WZC, Naidu R, Tang KS. See WZC, et al. Mol Neurobiol. 2022 Jun;59(6):3353-3369. doi: 10.1007/s12035-022-02799-2. Epub 2022 Mar 19. Mol Neurobiol. 2022. PMID: 35306641 Free PMC article. Review.
Cited by
- Analysis of LRRN3, MEF2C, SLC22A, and P2RY12 Gene Expression in the Peripheral Blood of Patients in the Early Stages of Parkinson's Disease.
Shulskaya MV, Semenova EI, Rudenok MM, Partevian SA, Lukashevich MV, Karabanov AV, Fedotova EY, Illarioshkin SN, Slominsky PA, Shadrina MI, Alieva AK. Shulskaya MV, et al. Biomedicines. 2024 Jun 23;12(7):1391. doi: 10.3390/biomedicines12071391. Biomedicines. 2024. PMID: 39061965 Free PMC article. - Intracellular Accumulation of α-Synuclein Aggregates Promotes S-Nitrosylation of MAP1A Leading to Decreased NMDAR-Evoked Calcium Influx and Loss of Mature Synaptic Spines.
Hallam RD, Buchner-Duby B, Stykel MG, Coackley CL, Ryan SD. Hallam RD, et al. J Neurosci. 2022 Dec 14;42(50):9473-9487. doi: 10.1523/JNEUROSCI.0074-22.2022. Epub 2022 Nov 22. J Neurosci. 2022. PMID: 36414406 Free PMC article. - Toward stem cell-based phenotypic screens for neurodegenerative diseases.
Khurana V, Tardiff DF, Chung CY, Lindquist S. Khurana V, et al. Nat Rev Neurol. 2015 Jun;11(6):339-50. doi: 10.1038/nrneurol.2015.79. Epub 2015 May 19. Nat Rev Neurol. 2015. PMID: 25986505 Review. - The impact of nimodipine combined with Ginkgo biloba extract on cognitive function and ADL scores in patients with Parkinson's disease: A retrospective study.
Zhang L, Sun H, Han Z. Zhang L, et al. Medicine (Baltimore). 2024 Jul 19;103(29):e38720. doi: 10.1097/MD.0000000000038720. Medicine (Baltimore). 2024. PMID: 39029001 Free PMC article. - Protein aggregation and calcium dysregulation are hallmarks of familial Parkinson's disease in midbrain dopaminergic neurons.
Virdi GS, Choi ML, Evans JR, Yao Z, Athauda D, Strohbuecker S, Nirujogi RS, Wernick AI, Pelegrina-Hidalgo N, Leighton C, Saleeb RS, Kopach O, Alrashidi H, Melandri D, Perez-Lloret J, Angelova PR, Sylantyev S, Eaton S, Heales S, Rusakov DA, Alessi DR, Kunath T, Horrocks MH, Abramov AY, Patani R, Gandhi S. Virdi GS, et al. NPJ Parkinsons Dis. 2022 Nov 24;8(1):162. doi: 10.1038/s41531-022-00423-7. NPJ Parkinsons Dis. 2022. PMID: 36424392 Free PMC article.
References
- Bonneh-Barkay D, Langston WJ, Di Monte DA. Toxicity of redox cycling pesticides in primary mesencephalic cultures. Antioxid. Redox Signal. 2005;7:649–653. - PubMed
- Chavarría C, Souza JM. Oxidation and nitration of α-synuclein and their implications in neurodegenerative diseases. Arch. Biochem. Biophys. 2013;533:25–32. - PubMed
- Clark J, Simon DK. Transcribe to survive: transcriptional control of antioxidant defense programs for neuroprotection in Parkinson’s disease. Antioxid. Redox Signal. 2009;11:509–528. - PubMed
- Cooper O, Seo H, Andrabi S, Guardia-Laguarta C, Graziotto J, Sundberg M, McLean JR, Carrillo-Reid L, Xie Z, Osborn T, et al. Pharmacological rescue of mitochondrial deficits in iPSC-derived neural cells from patients with familial Parkinson’s disease. Sci. Transl. Med. 2012;4 141ra90. - PMC - PubMed
Publication types
MeSH terms
Substances
Grants and funding
- P50 AG005131/AG/NIA NIH HHS/United States
- P30 NS076411/NS/NINDS NIH HHS/United States
- R01 NS086890/NS/NINDS NIH HHS/United States
- P01 HD29587/HD/NICHD NIH HHS/United States
- P01 HD029587/HD/NICHD NIH HHS/United States
- R37 CA084198/CA/NCI NIH HHS/United States
- P01 ES016738/ES/NIEHS NIH HHS/United States
- R01 CA084198/CA/NCI NIH HHS/United States
LinkOut - more resources
Full Text Sources
Other Literature Sources
Medical
Miscellaneous


