eggNOG v4.0: nested orthology inference across 3686 organisms - PubMed (original) (raw)
. 2014 Jan;42(Database issue):D231-9.
doi: 10.1093/nar/gkt1253. Epub 2013 Dec 1.
Kristoffer Forslund, Damian Szklarczyk, Kalliopi Trachana, Alexander Roth, Jaime Huerta-Cepas, Toni Gabaldón, Thomas Rattei, Chris Creevey, Michael Kuhn, Lars J Jensen, Christian von Mering, Peer Bork
Affiliations
- PMID: 24297252
- PMCID: PMC3964997
- DOI: 10.1093/nar/gkt1253
eggNOG v4.0: nested orthology inference across 3686 organisms
Sean Powell et al. Nucleic Acids Res. 2014 Jan.
Abstract
With the increasing availability of various 'omics data, high-quality orthology assignment is crucial for evolutionary and functional genomics studies. We here present the fourth version of the eggNOG database (available at http://eggnog.embl.de) that derives nonsupervised orthologous groups (NOGs) from complete genomes, and then applies a comprehensive characterization and analysis pipeline to the resulting gene families. Compared with the previous version, we have more than tripled the underlying species set to cover 3686 organisms, keeping track with genome project completions while prioritizing the inclusion of high-quality genomes to minimize error propagation from incomplete proteome sets. Major technological advances include (i) a robust and scalable procedure for the identification and inclusion of high-quality genomes, (ii) provision of orthologous groups for 107 different taxonomic levels compared with 41 in eggNOGv3, (iii) identification and annotation of particularly closely related orthologous groups, facilitating analysis of related gene families, (iv) improvements of the clustering and functional annotation approach, (v) adoption of a revised tree building procedure based on the multiple alignments generated during the process and (vi) implementation of quality control procedures throughout the entire pipeline. As in previous versions, eggNOGv4 provides multiple sequence alignments and maximum-likelihood trees, as well as broad functional annotation. Users can access the complete database of orthologous groups via a web interface, as well as through bulk download.
Figures
Figure 1.
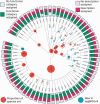
Taxonomic levels for which orthologous groups are provided, with functional annotation coverage displayed. This tree shows the levels of the Tree of Life for which eggNOG v4 provides orthologous groups. For internal nodes, the size of the orange circle increases with the number of species in the core/periphery set, which falls under this taxonomic level, respectively. Blue dot markers or circles denote the 67 of 107 taxonomic levels that are new to eggNOG v4 over eggNOG v3. The bar charts displayed at the edge show what fraction of orthologous groups have meaningful free-text descriptions or COG/KOG/arCOG functional categories assigned, respectively.
Figure 2.
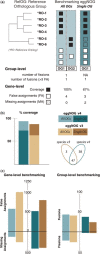
Benchmarking and comparing eggNOGv4 and eggNOGv3. (A) The performance of eggNOG database was evaluated at two levels: gene (identifying false and missing assignments) and group (identifying fusions and fissions) level using the Reference Orthologous Groups (RefOGs). Initially, we mapped the reference orthologs to the bilaterian-specific orthologous groups (biNOGs). We score eggNOG performance using (i) all orthologous groups (‘All OGs’) to identify the number of fissions and fusions for every RefOG and (ii) the orthologous group with the larger overlap with RefOG (‘Single OG’, i.e. OG1). Then, we calculated how many genes were predicted accurately (true assignments, TA, black box), how many genes were not predicted as orthologs (missing assignments, MA, striped white box) and how many genes were erroneous orthology predictions (false assignments, FA, white box). Depending on whether the user wants to evaluate the database on a ‘Single OG’ or ‘All OGs’ manner, it will change the numbers of true, missing and false assignments. (B) Comparison of the two most recent eggNOG versions (v3 and v4) in terms of %RefOG coverage (number of true assignments per total number of reference orthologs). Venn diagram shows the species number between the two database releases; there are 47 overlapping species that included the 12 animals that are used in the benchmarking data set. (C) Comparison of eggNOGv3 and eggNOGv4 at the gene level (false and missing assignments). The larger bars indicate a larger number of errors. (D) Comparison of eggNOGv3 and eggNOGv4 at the group level (fusion and fission events). The larger bars indicate a larger number of errors.
Figure 3.
Web site screenshots. The navigation tool has been improved to help users find relevant orthologous groups in a simple and intuitive way. The added insight of related groups is displayed inline with the use of chord diagrams. The thickness of the link (chord) between the groups represents the amount of proteins mapped between two orthologous group. The tooltips on the outer edge and chords display the amount of proteins mapped from a group and between groups, respectively.
Similar articles
- eggNOG v3.0: orthologous groups covering 1133 organisms at 41 different taxonomic ranges.
Powell S, Szklarczyk D, Trachana K, Roth A, Kuhn M, Muller J, Arnold R, Rattei T, Letunic I, Doerks T, Jensen LJ, von Mering C, Bork P. Powell S, et al. Nucleic Acids Res. 2012 Jan;40(Database issue):D284-9. doi: 10.1093/nar/gkr1060. Epub 2011 Nov 16. Nucleic Acids Res. 2012. PMID: 22096231 Free PMC article. - eggNOG: automated construction and annotation of orthologous groups of genes.
Jensen LJ, Julien P, Kuhn M, von Mering C, Muller J, Doerks T, Bork P. Jensen LJ, et al. Nucleic Acids Res. 2008 Jan;36(Database issue):D250-4. doi: 10.1093/nar/gkm796. Epub 2007 Oct 16. Nucleic Acids Res. 2008. PMID: 17942413 Free PMC article. - eggNOG v2.0: extending the evolutionary genealogy of genes with enhanced non-supervised orthologous groups, species and functional annotations.
Muller J, Szklarczyk D, Julien P, Letunic I, Roth A, Kuhn M, Powell S, von Mering C, Doerks T, Jensen LJ, Bork P. Muller J, et al. Nucleic Acids Res. 2010 Jan;38(Database issue):D190-5. doi: 10.1093/nar/gkp951. Epub 2009 Nov 9. Nucleic Acids Res. 2010. PMID: 19900971 Free PMC article. - Microbial genome analysis: the COG approach.
Galperin MY, Kristensen DM, Makarova KS, Wolf YI, Koonin EV. Galperin MY, et al. Brief Bioinform. 2019 Jul 19;20(4):1063-1070. doi: 10.1093/bib/bbx117. Brief Bioinform. 2019. PMID: 28968633 Free PMC article. Review. - The quest for orthologs: finding the corresponding gene across genomes.
Kuzniar A, van Ham RC, Pongor S, Leunissen JA. Kuzniar A, et al. Trends Genet. 2008 Nov;24(11):539-51. doi: 10.1016/j.tig.2008.08.009. Epub 2008 Sep 24. Trends Genet. 2008. PMID: 18819722 Review.
Cited by
- Average genome size estimation improves comparative metagenomics and sheds light on the functional ecology of the human microbiome.
Nayfach S, Pollard KS. Nayfach S, et al. Genome Biol. 2015 Mar 25;16(1):51. doi: 10.1186/s13059-015-0611-7. Genome Biol. 2015. PMID: 25853934 Free PMC article. - Characterization of a new bifunctional endo-1,4-β-xylanase/esterase found in the rumen metagenome.
Pavarina GC, Lemos EGM, Lima NSM, Pizauro JM Jr. Pavarina GC, et al. Sci Rep. 2021 May 17;11(1):10440. doi: 10.1038/s41598-021-89916-8. Sci Rep. 2021. PMID: 34001974 Free PMC article. - OrthoFinder: phylogenetic orthology inference for comparative genomics.
Emms DM, Kelly S. Emms DM, et al. Genome Biol. 2019 Nov 14;20(1):238. doi: 10.1186/s13059-019-1832-y. Genome Biol. 2019. PMID: 31727128 Free PMC article. - Multi-omics analyses reveal that the gut microbiome and its metabolites promote milk fat synthesis in Zhongdian yak cows.
Liu L, Wu P, Chen F, Zhou J, Guo A, Shi K, Zhang Q. Liu L, et al. PeerJ. 2022 Dec 2;10:e14444. doi: 10.7717/peerj.14444. eCollection 2022. PeerJ. 2022. PMID: 36518262 Free PMC article. - Isolation, Identification, and Investigation of Pathogenic Bacteria From Common Carp (Cyprinus carpio) Naturally Infected With Plesiomonas shigelloides.
Chen H, Zhao Y, Chen K, Wei Y, Luo H, Li Y, Liu F, Zhu Z, Hu W, Luo D. Chen H, et al. Front Immunol. 2022 Jun 30;13:872896. doi: 10.3389/fimmu.2022.872896. eCollection 2022. Front Immunol. 2022. PMID: 35844551 Free PMC article.
References
- Fitch WM. Distinguishing homologous from analogous proteins. Syst. Zool. 1970;19:99–113. - PubMed
- Tatusov RL, Koonin EV, Lipman DJ. A genomic perspective on protein families. Science. 1997;278:631–637. - PubMed
- Koonin EV, Aravind L, Kondrashov AS. The impact of comparative genomics on our understanding of evolution. Cell. 2000;101:573–576. - PubMed
- Tordai H, Nagy A, Farkas K, Bányai L, Patthy L. Modules, multidomain proteins and organismic complexity. FEBS J. 2005;272:5064–5078. - PubMed
Publication types
MeSH terms
Substances
LinkOut - more resources
Full Text Sources
Other Literature Sources
Research Materials


