Higher order amyloid fibril structure by MAS NMR and DNP spectroscopy - PubMed (original) (raw)
. 2013 Dec 26;135(51):19237-47.
doi: 10.1021/ja409050a. Epub 2013 Dec 13.
Marvin J Bayro, Anthony W Fitzpatrick, Vladimir Ladizhansky, Michael T Colvin, Marc A Caporini, Christopher P Jaroniec, Vikram S Bajaj, Melanie Rosay, Cait E Macphee, Michele Vendruscolo, Werner E Maas, Christopher M Dobson, Robert G Griffin
Affiliations
- PMID: 24304221
- PMCID: PMC3909659
- DOI: 10.1021/ja409050a
Higher order amyloid fibril structure by MAS NMR and DNP spectroscopy
Galia T Debelouchina et al. J Am Chem Soc. 2013.
Abstract
Protein magic angle spinning (MAS) NMR spectroscopy has generated structural models of several amyloid fibril systems, thus providing valuable information regarding the forces and interactions that confer the extraordinary stability of the amyloid architecture. Despite these advances, however, obtaining atomic resolution information describing the higher levels of structural organization within the fibrils remains a significant challenge. Here, we detail MAS NMR experiments and sample labeling schemes designed specifically to probe such higher order amyloid structure, and we have applied them to the fibrils formed by an eleven-residue segment of the amyloidogenic protein transthyretin (TTR(105-115)). These experiments have allowed us to define unambiguously not only the arrangement of the peptide β-strands into β-sheets but also the β-sheet interfaces within each protofilament, and in addition to identify the nature of the protofilament-to-protofilament contacts that lead to the formation of the complete fibril. Our efforts have resulted in 111 quantitative distance and torsion angle restraints (10 per residue) that describe the various levels of structure organization. The experiments benefited extensively from the use of dynamic nuclear polarization (DNP), which in some cases allowed us to shorten the data acquisition time from days to hours and to improve significantly the signal-to-noise ratios of the spectra. The β-sheet interface and protofilament interactions identified here revealed local variations in the structure that result in multiple peaks for the exposed N- and C-termini of the peptide and in inhomogeneous line-broadening for the residues buried within the interior of the fibrils.
Figures
Figure 1
The structure of the TTR(105-115) monomer in amyloid fibrils (PDB ID: 1RVS). The ensemble of 20 lowest energy structures is depicted.
Figure 2
DNP-enhanced 13C CP spectrum of TTR(105-115) fibrils labeled with 13C at the S115 carbonyl atom (top). An additional spectrum was recorded under identical experimental conditions but without microwave irradiation (bottom) in order to determine the enhancement due to DNP. The enhancement for the labeled carbonyl atom was 11, while the enhancement for the natural abundance signals in the sample was 13. Spectra were recorded on a spectrometer operating at 400 MHz 1H Larmor frequency.
Figure 3
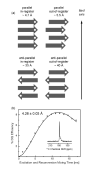
(a) Several possible arrangements of the β-strands within each sheet, along with the expected distances between labeled carbonyl atoms (white circles). (b) DNP-enhanced DQF-DRAWS experiment obtained at 400 MHz (1H Larmor frequency) with a sample labeled with 13C at the S115 carbonyl position. The fit distance is 4.26 ± 0.03 Å, consistent with a parallel, in-register intra-sheet arrangement. The inset shows the 1D DQF-DRAWS spectrum obtained with τmix = 12.2 ms to illustrate the sensitivity of the DNP-enhanced experiment. All mixing points were obtained in ~ 1.5 hours.
Figure 4
PAIN-CP 15N-13C correlation experiment used in defining the inter-sheet organization of the TTR(105-115) fibrils. The spectrum was obtained at a 1H Larmor frequency of 900 MHz with mixing (τmix = 10 ms) and a U-13C,15N YTIAALLSPYS labeled TTR(105-115) fibril sample. Inter-sheet correlations are labeled in red and intramolecular contributions are shown in black.
Figure 5
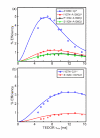
Experimental and simulated TEDOR buildup curves obtained from the cross-peak intensities in 2D ZF-TEDOR experiments recorded as a function of mixing time for (a) correlations to A108Cβ, and (b) correlations to I107Cδ1. The fitted distances are: 2.4 ± 0.2 Å for A108N-Cβ*, 4.8 ± 0.4 Å for I107N-A108Cβ*, 5.4 ± 0.5 Å for S112N-A108Cβ, 6.0 ± 0.4 Å for P113N-A108Cβ; 4.3 ± 0.5 Å for I107N-Cδ1*, and 5.8 ± 0.5 Å for S112N-I107Cδ1. The intra-molecular distances marked with asterisks are known (Ref. 29) and were used as a validation of the simulation procedure. Data were recorded at 750 MHz 1H Larmor frequency.
Figure 6
Two-dimensional 15N-13C correlation spectra recorded at a 1H Larmor frequency of 500 MHz with a YTIAALLSPYS labeled sample using (a) TEDOR mixing, and (b) a rotational resonance in the tilted frame width (R2TRW) experiment. Both spectra were recorded at a 10.1 kHz spinning rate and with the carrier frequency set at 65 ppm. The R2TRW mixing time was 25 ms with 83 kHz TPPM decoupling during mixing. Examples of two 13C recoupling fields used during the mixing period of the R2TRW experiment are given in (b).
Figure 7
Structure of the TTR(105-115) protofilament (PDB ID: 2m5n, Ref. 30). (a) View along the fibril axis with an emphasis on the parallel, in-register β-strands within each β-sheet. (b) Summary of the observed quantitative contacts that constrain the odd-even-odd-even anti-parallel β-sheet interface. Contacts in black were observed in TEDOR spectra, while the distances labeled in red were measured using an R2TRW experiments. Images were produced with the Chimera software.
Figure 8
The two possible arrangements of the protofilaments are (a) head-to-tail, and (b) head-to-head arrangements. The black circles correspond to a 15N label in the N-terminus of the peptide, while the white circles represent the 13C labeled carbonyl atom of the C-terminus, and the shortest expected 15N-13C distances in each case are indicated. (c) A 1D DNP-enhanced 15N-13C experiment recorded at a 1H Larmor frequency of 400 MHz with REDOR mixing was used to measure the distance between the two labels. The fit distance is 3.51 ± 0.09 Å, consistent with a head-to-tail protofilament organization.
Figure 9
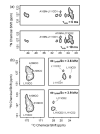
Multiple peaks are observed in the spectra reflecting the four chemical environments (a) expected for the termini in the TTR(105-115) fibrils (marked with arrows for the C-terminal case), PDB ID:2m5k (Ref. 30). (b) 13C MAS CP and (c) 15N MAS CP spectra of a sample labeled with 13C at the carbonyl S115 position and with 15N at the Y105 position obtained at a 1H Larmor frequency of 500 MHz. (d) TEDOR spectrum obtained with τmix = 8.5 ms at the same field. The 13C chemical shifts of the two cross-peaks match the chemical shifts of the two major peaks in the 1D spectrum, while the average 15N chemical shift of the cross-peaks matches the chemical shift of the major 15N peak.
Similar articles
- Amyloid fibril formation by A beta 16-22, a seven-residue fragment of the Alzheimer's beta-amyloid peptide, and structural characterization by solid state NMR.
Balbach JJ, Ishii Y, Antzutkin ON, Leapman RD, Rizzo NW, Dyda F, Reed J, Tycko R. Balbach JJ, et al. Biochemistry. 2000 Nov 14;39(45):13748-59. doi: 10.1021/bi0011330. Biochemistry. 2000. PMID: 11076514 - High-resolution MAS NMR analysis of PI3-SH3 amyloid fibrils: backbone conformation and implications for protofilament assembly and structure.
Bayro MJ, Maly T, Birkett NR, Macphee CE, Dobson CM, Griffin RG. Bayro MJ, et al. Biochemistry. 2010 Sep 7;49(35):7474-84. doi: 10.1021/bi100864t. Biochemistry. 2010. PMID: 20707313 Free PMC article. - High-resolution molecular structure of a peptide in an amyloid fibril determined by magic angle spinning NMR spectroscopy.
Jaroniec CP, MacPhee CE, Bajaj VS, McMahon MT, Dobson CM, Griffin RG. Jaroniec CP, et al. Proc Natl Acad Sci U S A. 2004 Jan 20;101(3):711-6. doi: 10.1073/pnas.0304849101. Epub 2004 Jan 8. Proc Natl Acad Sci U S A. 2004. PMID: 14715898 Free PMC article. - Protein structure determination by magic-angle spinning solid-state NMR, and insights into the formation, structure, and stability of amyloid fibrils.
Comellas G, Rienstra CM. Comellas G, et al. Annu Rev Biophys. 2013;42:515-36. doi: 10.1146/annurev-biophys-083012-130356. Epub 2013 Mar 22. Annu Rev Biophys. 2013. PMID: 23527778 Review. - Solid-state NMR as a method to reveal structure and membrane-interaction of amyloidogenic proteins and peptides.
Naito A, Kawamura I. Naito A, et al. Biochim Biophys Acta. 2007 Aug;1768(8):1900-12. doi: 10.1016/j.bbamem.2007.03.025. Epub 2007 Apr 5. Biochim Biophys Acta. 2007. PMID: 17524351 Review.
Cited by
- Line-Broadening in Low-Temperature Solid-State NMR Spectra of Fibrils.
Bauer T, Dotta C, Balacescu L, Gath J, Hunkeler A, Böckmann A, Meier BH. Bauer T, et al. J Biomol NMR. 2017 Jan;67(1):51-61. doi: 10.1007/s10858-016-0083-4. Epub 2017 Feb 4. J Biomol NMR. 2017. PMID: 28161758 - Structural Changes Associated with Transthyretin Misfolding and Amyloid Formation Revealed by Solution and Solid-State NMR.
Lim KH, Dasari AK, Hung I, Gan Z, Kelly JW, Wemmer DE. Lim KH, et al. Biochemistry. 2016 Apr 5;55(13):1941-4. doi: 10.1021/acs.biochem.6b00164. Epub 2016 Mar 23. Biochemistry. 2016. PMID: 26998642 Free PMC article. - Structural Insights into Bound Water in Crystalline Amino Acids: Experimental and Theoretical (17)O NMR.
Michaelis VK, Keeler EG, Ong TC, Craigen KN, Penzel S, Wren JE, Kroeker S, Griffin RG. Michaelis VK, et al. J Phys Chem B. 2015 Jun 25;119(25):8024-36. doi: 10.1021/acs.jpcb.5b04647. Epub 2015 Jun 10. J Phys Chem B. 2015. PMID: 25996165 Free PMC article. - Time-optimized pulsed dynamic nuclear polarization.
Tan KO, Yang C, Weber RT, Mathies G, Griffin RG. Tan KO, et al. Sci Adv. 2019 Jan 18;5(1):eaav6909. doi: 10.1126/sciadv.aav6909. eCollection 2019 Jan. Sci Adv. 2019. PMID: 30746482 Free PMC article. - Combining DNP NMR with segmental and specific labeling to study a yeast prion protein strain that is not parallel in-register.
Frederick KK, Michaelis VK, Caporini MA, Andreas LB, Debelouchina GT, Griffin RG, Lindquist S. Frederick KK, et al. Proc Natl Acad Sci U S A. 2017 Apr 4;114(14):3642-3647. doi: 10.1073/pnas.1619051114. Epub 2017 Mar 22. Proc Natl Acad Sci U S A. 2017. PMID: 28330994 Free PMC article.
References
- Chiti F, Dobson CM. Annu. Rev. Biochem. 2006;75:333–366. - PubMed
- Fowler DM, Koulov AV, Balch WE, Kelly JW. TRENDS Biochem. Sci. 2007;32:217–224. - PubMed
- Dobson CM. Nature. 2003;426:884–890. - PubMed
- Nilsson MR. Methods. 2004;34:151–160. - PubMed
- Sunde M, Serpell LC, Bartlam M, Fraser PE, Pepys MB, Blake CCF. J. Mol. Biol. 1997;273:729–739. - PubMed
Publication types
MeSH terms
Substances
Grants and funding
- P41 EB002026/EB/NIBIB NIH HHS/United States
- R01 EB002804/EB/NIBIB NIH HHS/United States
- EB-003151/EB/NIBIB NIH HHS/United States
- 089703/WT_/Wellcome Trust/United Kingdom
- EB-002026/EB/NIBIB NIH HHS/United States
- R01 EB003151/EB/NIBIB NIH HHS/United States
- BB/H003843/1/BB_/Biotechnology and Biological Sciences Research Council/United Kingdom
- BB/C00759X/2/BB_/Biotechnology and Biological Sciences Research Council/United Kingdom
LinkOut - more resources
Full Text Sources
Other Literature Sources
Research Materials
Miscellaneous


