Ultrafast endocytosis at mouse hippocampal synapses - PubMed (original) (raw)
. 2013 Dec 12;504(7479):242-247.
doi: 10.1038/nature12809. Epub 2013 Dec 4.
Affiliations
- PMID: 24305055
- PMCID: PMC3957339
- DOI: 10.1038/nature12809
Ultrafast endocytosis at mouse hippocampal synapses
Shigeki Watanabe et al. Nature. 2013.
Abstract
To sustain neurotransmission, synaptic vesicles and their associated proteins must be recycled locally at synapses. Synaptic vesicles are thought to be regenerated approximately 20 s after fusion by the assembly of clathrin scaffolds or in approximately 1 s by the reversal of fusion pores via 'kiss-and-run' endocytosis. Here we use optogenetics to stimulate cultured hippocampal neurons with a single stimulus, rapidly freeze them after fixed intervals and examine the ultrastructure using electron microscopy--'flash-and-freeze' electron microscopy. Docked vesicles fuse and collapse into the membrane within 30 ms of the stimulus. Compensatory endocytosis occurs within 50 to 100 ms at sites flanking the active zone. Invagination is blocked by inhibition of actin polymerization, and scission is blocked by inhibiting dynamin. Because intact synaptic vesicles are not recovered, this form of recycling is not compatible with kiss-and-run endocytosis; moreover, it is 200-fold faster than clathrin-mediated endocytosis. It is likely that 'ultrafast endocytosis' is specialized to restore the surface area of the membrane rapidly.
Figures
Fig. 1
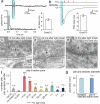
Channelrhodopsin activation induces action potential-driven vesicle fusion. (a) Cell-attached voltage clamp recordings of light-evoked action potentials. The histogram shows the average number of action potentials at different time points after the light application. Each column is binned by 10 ms. (b) Sample trace of light-evoked post-synaptic currents. Arrows indicate freezing times at 15, 30, 50, and 100 ms. Representative micrographs of fusing vesicles at 15 ms (c) and 30 ms (d) after the light onset. (e) A micrograph showing two exocytic intermediates in the active zone. (f) Average number of pits in the active zone at different time points after stimulation. (g) Diameter of synaptic vesicles (41.1 ± 0.1 nm; n = 382) and pits in active zones (40.9 ± 1.2 nm; n = 62; p = 0.7). *** and * indicate p-values of <0.0001 and <0.006, respectively. n.s., ‘not significant’. Error bars, s.e.m.
Fig. 2
Docked vesicles are the morphological correlates of the readily-releasable pool. (a) An sample micrograph showing docked and tethered vesicles. (b) Recovery of docked vesicles. The number of docked vesicles is normalized to the non-stimulated control (0 ms). The tau for recovery was 3.8 s. Average number of vesicles docked (c) or tethered (d) in the active zone at time points after the stimulus. For detailed numbers and statistical analysis, see Supplementary Table 1. *** and * indicate p-values of <0.0001 and <0.006, respectively. n.s., ‘not significant’. Error bars, s.e.m.
Fig. 3
Large invaginations immediately next to the active zone are endocytic intermediates. Representative micrographs showing invaginations and large vesicles in the periactive zone at 50 ms (a), 100 ms (b,c) and 300 ms (d) after stimulation. Sample micrographs (e-g) showing ferritin uptake into these large endocytic structures at 100 ms after stimulation. (h) Diameter of large vesicles (82.0±1.2; n = 572) and endocytic invaginations (86.0±2.4 nm; n = 51; p = 0.33). (i) Number of shallow pits (< 40 nm), deep pits (> 40 nm), and large vesicles (<50 nm from plasma membrane) in the periactive zone at different time points after stimulation. (j) Number of shallow pits, deep pits, and large vesicles in the periactive zone at different time points after stimulation in Munc13 DKO. For detailed numbers and statistical analysis, see Supplementary Table 1. n.s., ‘not significant’. Error bars, s.e.m.
Fig. 4
Endocytosis is localized to sites flanking the active zone. Tomograms of synapses frozen (a) 50 ms or (b) 100 ms after stimulation. Left, a virtual 2 nm section from the tomograms. Middle, orthogonal views of the reconstructed volumes. Right, tilted views of the reconstructed volumes. The postsynaptic density is colored red to delineate the extent of the active zone. Black and white arrows indicates fusing vesicles and endocytic pits, respectively. Arrows outlined in red indicate the plane of the image shown in the left panels. (c) Number of shallow pits, deep pits, and large vesicles in the periactive zone at different time points after stimulation. (d) Diameter of large vesicles (78.0 ± 3.3 nm; n = 6) and endocytic invaginations (76.3 ± 1.9 nm; n = 15; p = 0.56). (e) Distribution of pits relative to the edge of active zone. For detailed numbers and statistical analysis, see Supplementary Table 1. n.s., ‘not significant’. Error bars, s.e.m.
Fig. 5
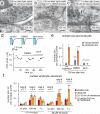
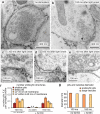
Ultrafast endocytosis is mediated by actin and dynamin. Representative micrographs showing 10 μM latrunculin-A (a) and 0.1% DMSO (b) 100 ms after light stimulation. (c) A representative micrograph showing 80 μM dynasore-treated cells 1 s after light stimulation. (d) Traces of average post-synaptic currents in the absence of drugs, during the DMSO application, and during the latrunculin-A application. (e) Average number of exocytic pits (blue) and endocytic pits (orange) in the latrunculin-A or DMSO treated cells. (f) Number of shallow pits, deep pits, large vesicles associated with the membrane (< 5 nm) and large vesicles associated with the active zone (6-50 nm of the membrane). Controls are from the samples in Fig. 3. For detailed numbers and statistical analysis, see Supplementary Table 1. *** indicates p-values of <0.0001. n.s., ‘not significant’. Error bars, s.e.m.
Extended Data Fig. 1
A schematic summarizing ultrafast endocytosis. Exocytosis in the active zone is followed by rapid internalization of membrane at the edge of the active zone. Synaptic vesicles directly in contact with plasma membrane fuse about 2 ms after an action potential and collapse into membrane. Ultrafast endocytosis occurs at the edge of active zone within 100 ms after stimulation and is mediated by actin and dynamin. The endocytic structures are larger than synaptic vesicles. AZ, active zone. PSD, postsynaptic density.
Extended Data Fig. 2
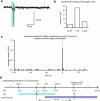
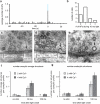
Channelrhodopsin induces action potential-driven vesicle fusion. (a) Cell-attached voltage clamp recordings of single light-evoked action potentials in presence of synaptic blockers NBQX and bicuculline. (b) Number of action potentials triggered during the 10 ms light pulse. Most cells fired at least one action potential during the light pulse (88%, 30/34), though some cells did not respond to the light stimulus (12%, 4/34). Some cells fired a second action potential (26%, 7/34). (c) A histogram showing the average number of action potentials at different time points before and after the light application. Each column is binned by 10 ms. Action potentials observed after light-off are likely due to the spontaneous activity of cells. (d) Freezing protocol for ’15 ms’ samples. A single light pulse was fired at 0 ms. At 7 ms after light onset, the chamber was flooded with liquid nitrogen. At 8 ms after application of liquid nitrogen, the sample should reach 0°C (when the chamber temperature is at −20°C), so that the sample was frozen 15 ms after light onset. Action potentials are initiated 4.8 ms after light onset on average. Thus, the ’15 ms’ freeze is capturing events that occurred on average 10.2 ms after the action potential.
Extended Data Fig. 3
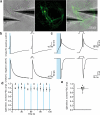
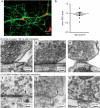
Light and electrical stimulation in the same cell elicits identical postsynaptic currents. (a) Paired whole-cell recordings of ChetaTC expressing (YFP) and and non-expressing neurons that were co-cultured on small microislands of astrocytes. Action potentials were triggered every 10 s in the ChetaTC positive cell by alternating between 10 ms current injection via the patch pipette and 10 ms light flashes. (b) Example of a cell pair with a GABAergic ChetaTC positive neuron. Presynaptic action potentials were recorded in current clamp (CC) of the ChetaTC positive cell. Postsynaptic IPSCs were recorded in voltage clamp (VC) from the non-infected neuron (bottom panel; holding potential −50 mV). (c) Presynaptic action potentials and EPSCs evoked by light or somatic depolarization in a pair of neurons with a glutamatergic ChetaTC positive neuron. The postsynaptic cell was voltage-clamped at −70 mV. (d) Time plot of postsynaptic responses triggered by alternating light-induced depolarizaion (blue bars / open symbols) and electrical stimulation (current step / closed symbols). Both EPSC and IPSC amplitudes were normalized to the first response evoked by electrical stimulation and pooled (n=9). (e) Scatter plot of postsynaptic currents evoked by ChetaTC stimulation normalized to direct electrical stimulation in the same neuron. Reponses are not different for the two modes of action potential induction (p = 0.77, one sample t-test). Error bars, s.e.m.
Extended Data Fig. 4
Large invaginations adjacent to the active zone are endocytic intermediates. Additional representative micrographs showing shallow invaginations 50 ms after stimulation (a, e, i), deep invaginations 100 ms after stimulation (b,c,f,g,j,k) and large vesicles at the edge of active zone 300 ms after stimulation (d,h,l). (m,o) coats are usually absent on ultrafast invaginations, but can occasionally be observed (j,k arrow). But these differ from those observed at classical clathrin coated pits (n) or vesicles (p). The coated pit (n) was not observed at the synapse but was rather at the plasma membrane of soma.
Extended Data Fig. 5
Large invaginations take up a fluid phase marker. Additional representative micrographs showing ferritin uptake in the whole terminal in non-stimulation control (a) and 100 ms after stimulation (b) and by large structures at the edge of active zones 100 ms after stimulation (c-e). An arrow in (b) indicates a ferritin-positive shallow pit. Ferritin was applied to cells for 5 minutes prior to the light stimulation. Note that very little ferritin was internalized during the pre-incubation period, suggesting that the ferritin distribution is associated acutely with endocytosis after the stimulation. In unstimulated cultures, 18% of the profiles exhibited some internalization of ferritin, of those profiles only 1 vesicle from the ~56 total vesicles contained ferritin. At 100 ms, 26% of the profiles exhibited synaptic vesicles with ferritin (p = 0.29), of those profiles that had internalized ferritin only 1 vesicle from 51.2 total vesicles contained ferritin. Thus, ultrafast endocytosis did not directly generate detectable numbers of synaptic vesicles with ferritin. (f) Number of shallow pits (< 40 nm), deep pits (>40 nm), large vesicles associated with the membrane (< 5 nm) and large vesicles associated with the plasma membrane (6-50 nm of the membrane) in controls and ferritin-containing seeded cultures. In ferritin seeded cultures the large vesicles near the membrane (within 5 nm) all contained ferritin. The total number of ferritin-positive endocytic structures was 0.38 ± 0.03 endocytic structures per profile, similar to the endocytosis values obtained in Fig. 3i without ferritin (0.43 ± 0.03 endocytic structures per profile). (g) Diameter of large vesicles (86.0 ± 2.4; n = 51) and endocytic invaginations (77.3±3 nm; n = 16; p = 0.33). “No ferritin” controls are from the samples in Fig. 3. Error bars, s.e.m.
Extended Data Fig. 6
Ultrafast endocytosis occurs with similar dynamics in 2 mM and 4mM extracellular calcium. (a) A histogram showing the average number of action potentials at different time points before and after the light application in an external solution with 2 mM calcium. Each column is binned by 10 ms. Action potentials observed after light-off are likely due to spontaneous activity of cells. (b) Average number of action potentials triggered during the 10 ms light pulse. An action potential was observed during the light pulse in 73% of the cells (11/15), 13% (2/15) fired a second action potential within the 10 ms light pulse. No action potential was observed in 27% of the cells (4/15). (c-e) Representative micrographs showing invaginations and large vesicles in the periactive zone at 100 ms after stimulation. (f,g) Average number of exocytic pits (f) and endocytic structures (g) at 0 ms (no stim), 30 ms, and 100 ms after stimulation in 2 mM calcium (light gray) and in 4 mM calcium (dark gray) conditions. Endocytic structures include shallow and deep pits summed. 4 mM data are from the samples in Fig. 1 and 3. Error bars, s.e.m.
Extended Data Fig. 7
Ultrafast endocytosis is mediated by actin. (a) Electrophysiological recordings on mixed cultures. PSCs were recorded from ChetaTC-negative neurons (red fluorescence) while stimulating ChetaTC/YFP positive neurons with light. (b) Scatter plot of postsynaptic currents evoked by channelrhodopsin stimulation in 10 μM latrunculin-A/ 0.1% DMSO normalized to postsynaptic currents in 0.1% DMSO in the same neuron. 30 s incubation with latrunculin-A has no effect on evoked neurotransmission. Average PSC amplitudes were normalized to average PSC amplitudes preceding latrunculin-A application (n=8, normalized PSC in lat-A is 0.95 ± 0.08, p=0.6, one sample t-test). Additional representative micrographs showing 10 μM latrunculin-A (c-e) and 0.1% DMSO (f-h) treated cells 100 ms after stimulation. Ultrafast endocytosis occurs in DMSO-treated cells but is completely blocked in latrunculin-A treated cells. Error bar, s.e.m.
Extended Data Fig. 8
Ultrafast endocytosis is mediated by dynamin. Additional representative micrographs showing 80 μM dynasore-treated cells from 40-nm thick sections (a-c) and a 200-nm tomogram (d-f). Ultrafast endocytic structures are trapped on the surface in the dynasore-treated cells. Note that large vesicles are found associated with the membrane (a-c, d, and f) but the neck of the trapped structures are only visible at their center (a, e) due to the thickness of the sections. Electron tomography was performed on 21 sections (200-nm thick). 9 out of 21 tomograms showed a trapped structure, and all of these trapped structures were connected to the membrane at their center.
Extended Data Fig. 9
Ice crystal damage was not observed in cell cultures subjected to high pressure freezing. Sample micrographs show a nucleus (a,d), a mitochondrion (b,e), and a synapse (c,f). (a-c), In these samples there is no visible damage by ice crystals. (d-f), Samples exhibiting ice crystal damage caused by brief accidental removal from liquid nitrogen. Note the reticulated appearance caused by protein aggregation. Ice damage was not observed in the samples used in this study.
Comment in
- Neuroscience: Faster than kiss-and-run.
Cho S, von Gersdorff H. Cho S, et al. Nature. 2013 Dec 12;504(7479):220-1. doi: 10.1038/nature12842. Epub 2013 Dec 4. Nature. 2013. PMID: 24305050 No abstract available. - Ultrafast synaptic endocytosis cycles to the center stage.
Zhou L, McInnes J, Verstreken P. Zhou L, et al. Dev Cell. 2014 Jan 13;28(1):5-6. doi: 10.1016/j.devcel.2013.12.017. Dev Cell. 2014. PMID: 24434135
Similar articles
- Inhibition of dynamin completely blocks compensatory synaptic vesicle endocytosis.
Newton AJ, Kirchhausen T, Murthy VN. Newton AJ, et al. Proc Natl Acad Sci U S A. 2006 Nov 21;103(47):17955-60. doi: 10.1073/pnas.0606212103. Epub 2006 Nov 8. Proc Natl Acad Sci U S A. 2006. PMID: 17093049 Free PMC article. - Membrane compression by synaptic vesicle exocytosis triggers ultrafast endocytosis.
Ogunmowo TH, Jing H, Raychaudhuri S, Kusick GF, Imoto Y, Li S, Itoh K, Ma Y, Jafri H, Dalva MB, Chapman ER, Ha T, Watanabe S, Liu J. Ogunmowo TH, et al. Nat Commun. 2023 May 20;14(1):2888. doi: 10.1038/s41467-023-38595-2. Nat Commun. 2023. PMID: 37210439 Free PMC article. - Actin- and dynamin-dependent maturation of bulk endocytosis restores neurotransmission following synaptic depletion.
Nguyen TH, Maucort G, Sullivan RK, Schenning M, Lavidis NA, McCluskey A, Robinson PJ, Meunier FA. Nguyen TH, et al. PLoS One. 2012;7(5):e36913. doi: 10.1371/journal.pone.0036913. Epub 2012 May 22. PLoS One. 2012. PMID: 22629340 Free PMC article. - Clathrin-mediated endocytosis: the physiological mechanism of vesicle retrieval at hippocampal synapses.
Granseth B, Odermatt B, Royle SJ, Lagnado L. Granseth B, et al. J Physiol. 2007 Dec 15;585(Pt 3):681-6. doi: 10.1113/jphysiol.2007.139022. Epub 2007 Jun 28. J Physiol. 2007. PMID: 17599959 Free PMC article. Review. - The Synaptic Vesicle Cycle Revisited: New Insights into the Modes and Mechanisms.
Chanaday NL, Cousin MA, Milosevic I, Watanabe S, Morgan JR. Chanaday NL, et al. J Neurosci. 2019 Oct 16;39(42):8209-8216. doi: 10.1523/JNEUROSCI.1158-19.2019. J Neurosci. 2019. PMID: 31619489 Free PMC article. Review.
Cited by
- Strength and precision of neurotransmission at mammalian presynaptic terminals.
Takahashi T. Takahashi T. Proc Jpn Acad Ser B Phys Biol Sci. 2015;91(7):305-20. doi: 10.2183/pjab.91.305. Proc Jpn Acad Ser B Phys Biol Sci. 2015. PMID: 26194855 Free PMC article. Review. - Phosphatidylinositol 3-Kinase Couples Localised Calcium Influx to Activation of Akt in Central Nerve Terminals.
Nicholson-Fish JC, Cousin MA, Smillie KJ. Nicholson-Fish JC, et al. Neurochem Res. 2016 Mar;41(3):534-43. doi: 10.1007/s11064-015-1663-5. Epub 2015 Jul 22. Neurochem Res. 2016. PMID: 26198194 Free PMC article. - A trans-synaptic nanocolumn aligns neurotransmitter release to receptors.
Tang AH, Chen H, Li TP, Metzbower SR, MacGillavry HD, Blanpied TA. Tang AH, et al. Nature. 2016 Aug 11;536(7615):210-4. doi: 10.1038/nature19058. Epub 2016 Jul 27. Nature. 2016. PMID: 27462810 Free PMC article. - Neural activity selects myosin IIB and VI with a specific time window in distinct dynamin isoform-mediated synaptic vesicle reuse pathways.
Hayashida M, Tanifuji S, Ma H, Murakami N, Mochida S. Hayashida M, et al. J Neurosci. 2015 Jun 10;35(23):8901-13. doi: 10.1523/JNEUROSCI.5028-14.2015. J Neurosci. 2015. PMID: 26063922 Free PMC article. - Plastin 3 in health and disease: a matter of balance.
Wolff L, Strathmann EA, Müller I, Mählich D, Veltman C, Niehoff A, Wirth B. Wolff L, et al. Cell Mol Life Sci. 2021 Jul;78(13):5275-5301. doi: 10.1007/s00018-021-03843-5. Epub 2021 May 23. Cell Mol Life Sci. 2021. PMID: 34023917 Free PMC article. Review.
References
Publication types
MeSH terms
Substances
Grants and funding
- NS034307/NS/NINDS NIH HHS/United States
- R37 NS034307/NS/NINDS NIH HHS/United States
- R01 NS034307/NS/NINDS NIH HHS/United States
- 249939/ERC_/European Research Council/International
- HHMI/Howard Hughes Medical Institute/United States
LinkOut - more resources
Full Text Sources
Other Literature Sources
