Structure of the TRPV1 ion channel determined by electron cryo-microscopy - PubMed (original) (raw)
Structure of the TRPV1 ion channel determined by electron cryo-microscopy
Maofu Liao et al. Nature. 2013.
Abstract
Transient receptor potential (TRP) channels are sensors for a wide range of cellular and environmental signals, but elucidating how these channels respond to physical and chemical stimuli has been hampered by a lack of detailed structural information. Here we exploit advances in electron cryo-microscopy to determine the structure of a mammalian TRP channel, TRPV1, at 3.4 Å resolution, breaking the side-chain resolution barrier for membrane proteins without crystallization. Like voltage-gated channels, TRPV1 exhibits four-fold symmetry around a central ion pathway formed by transmembrane segments 5-6 (S5-S6) and the intervening pore loop, which is flanked by S1-S4 voltage-sensor-like domains. TRPV1 has a wide extracellular 'mouth' with a short selectivity filter. The conserved 'TRP domain' interacts with the S4-S5 linker, consistent with its contribution to allosteric modulation. Subunit organization is facilitated by interactions among cytoplasmic domains, including amino-terminal ankyrin repeats. These observations provide a structural blueprint for understanding unique aspects of TRP channel function.
Conflict of interest statement
The authors declare no competing financial interests.
Figures
Figure 1. 3D reconstruction of TRPV1 determined by single-particle cryo-EM
a, Representative electron micrograph of TRPV1 protein embedded in a thin layer of vitreous ice recorded at a defocus of 1.7µm. b, Fourier transform of micrograph shown in a, with Thon rings extending to nearly 3Å. c, Enlarged views of three representative 2D class averages show fine features of tetrameric channel complex. d–g, 3D density map of TRPV1 channel filtered to a resolution of 3.4Å (scaled to atomic structure) with each subunit color-coded. Four different views of the channel are shown, from side (d, e), top (f), and bottom (g). The arrow in panel d indicates β-sheet structure in the cytosolic domain of TRPV1.
Figure 2. TRPV1 and VGICs share similar 4-fold symmetric architecture
a–d, Ribbon diagram of TRPV1 atomic model with each of the four identical subunits color-coded, showing views from side (a and b). The dimensions of the channel and the length of the membrane-spanning helices are indicated. The dimensions of the TRPV1 tetramer are 100Å by 110Å by 110Å, as compared with 135Å by 95Å by 95Å for the rat Kv1.2 potassium channel. c, Ribbon diagram focusing in on side view of S5-P-S6 pore with TRP domains. d, Bottom view focusing on transmembrane core, including S1–S4, S5-P-S6, and TRP domains. Note that S1–S4 domains flank and interact with S5-P-S6 pore modules from adjacent subunit, reminiscent of VGIC architecture.
Figure 3. Structural details of a single TRPV1 subunit
a, Linear diagram depicting major structural domains in a TRPV1 subunit, color coded to match ribbon diagrams below. Dashed boxes denote regions for which density was not observed (first two ankyrin repeats) or where specific residues could not be definitively assigned (C-terminal β-strand). b, Ribbon diagrams showing three different views of a TRPV1 monomer denoting specific domains.
Figure 4. Unique structural features of TRPV1
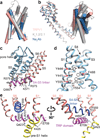
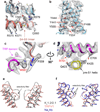
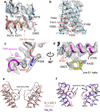
a, Alignment of S1–S4 transmembrane domains from TRPV1 (salmon), Kv1.2/2.1 chimera (PDB 2R9R; grey), and NavAb (PDB 3RVY; blue) show substantial overlap. b, When S5-P-S6 pore regions are aligned, the S1–S4 domains show differential relative orientations. c, The S4–S5 linker is an amphipathic α-helix whose charged surface faces the cytosol. Potential cation-π interactions between Y565 in the S4–S5 linker and R579 from S5 of the adjacent subunit are highlighted. Mutations of cognate residues in TRPV4 render the channel constitutively active and cause skeletal dysplasia. d, Aromatic side chains from S1, S3 and S4 helices create a hydrophobic interior in the S1–S4 domains, in contrast to the charged environment observed in VGICs. e, Two different views highlight interactions between TRP domain and S4–S5 linker and pre-S1 helix. Interactions (i.e. hydrogen bonds and salt bridge) are indicated by dashed lines.
Figure 5. The ion permeation pathway of TRPV1
a, Cryo-EM densities of the pore in longitudinal cross section are superimposed on an atomic model. Only two diagonally opposed subunits are shown for clarity. Several residues along the pore are labeled for orientation. Arrows denote positions of density maps for horizontal cross sections shown in panels d–g, as indicated. b, Solvent-accessible pathway along the pore mapped using the HOLE program. Residues located at the selective filter and lower gate are rendered as sticks. c, radius of the pore calculated with program HOLE. d–g, Cryo-EM densities of several residues along the pore are superimposed on the atomic model; all panels represent views along the four-fold axis, showing residues from each subunit of the homo-tetrameric channel.
Figure 6. Cytosolic interactions mediated by ankyrin repeat domains
a, Cryo-EM density is well fitted by crystal structure of TRPV1 ankyrin repeats 3–6 (PDB code: 2PNN) as a rigid body. Ankyrin repeats 1 and 2 are not observed, presumably due to high flexibility. b, Fingers 3 and inner helices from ankyrin repeat 3 and 4 on the concave surface of the ARD interact with β–strands from the linker and C-terminus of an adjacent subunit.
Extended Data Figure 1. A minimal TRPV1 channel that is functional and biochemically stable
a, Mammalian (HEK293) cells expressing a minimal construct (with an N-terminal GFP tag) responded to various TRPV1 agonists, including capsaicin (Cap; 0.5 µM), extracellular protons (pH 5.0), and double-knot spider toxin (DkTx; 2 µM). Electrophysiological responses were measured in whole-cell patch-clamp configuration. b–c, Dose responsive curves for capsaicin (b) or protons (c) were determined for minimal (black) or full length (red) TRPV1, both of which contained an N-terminal GFP fusion. Values were normalized to maximal currents evoked by 30 µM capsaicin (b) or pH 4.0 (c) (n=6 independent whole cell recordings). d, DkTx dose response curves for minimal (black) or full length (red) TRPV1 as in (b) and (c) determined by calcium imaging. Values were normalized to maximal capsaicin- (10 µM) evoked response in transfected HEK293 cells (n>30 per point). e, Thermal response profiles for minimal (black) or full length (red) TRPV1 expressing oocytes reveal similar heat sensitivity. f, Ion permeability ratios of agonist-evoked currents from minimal TRPV1 were estimated from reversal potential shifts in whole-cell patch-clamp recordings of transfected HEK293 cells, revealing no significant differences from full length channel. g, Gel filtration profile (Superdex-200) of detergent solubilized TRPV1 after purification on amylose affinity resin and proteolytic removal of MBP tag. The major species elutes as a symmetrical peak after the void volume (V0). Inset shows that peak material migrates as a single, homogeneous band on SDS-PAGE (4–12% gradient gel; Coomassie stain).
Extended Data Figure 2. Sequence alignment of TRPV1 to other TRPV family members
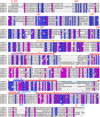
The rat TRPV1 construct used for this study consists of residues 110 to 764 (indicated by red arrows), excluding the highly divergent region (604–626, highlighted by cyan box). Secondary structure elements are indicated above the sequence. The starting points of six ankyrin repeats are based on a crystal structure of ARD of TRPV1 (PDB ID: 2PNN). Several critical residues discussed in the text are labeled in blue, and conserved glycine and proline residues at the turn of a β-sheet (highlighted in Figure 6) are indicated with red stars.
Extended Data Figure 3. Negative stain EM of TRPV1
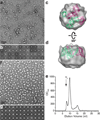
a, Representative negative stain image of purified minimal TRPV1 protein in detergent (DDM) after proteolytic removal of MBP tag. b, 2D class averages of negatively stained particles in DDM. c, d, Two views of a random conical tilt (RCT) reconstruction from negatively stained TRPV1 in DDM. The RCT reconstruction was low pass filtered at 30Å, and fitted with the structure of NavAb (PDB ID: 3RVY) to indicate the size and general shape. e, Gel filtration profile (Superdex-200) of purified minimal TRPV1 protein after exchange from DDM into amphipols. The major species elutes as a symmetrical peak after the void volume (V0). f, Representative negative stain image of purified minimal TRPV1 protein without MBP tag in amphipols. g, 2D class averages of negative stain particles in amphipols.
Extended Data Figure 4. Cryo-EM of TRPV1 using Tecnai TF20 microscope and TemF816 8K × 8K CMOS camera
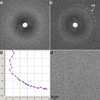
a–d, Representative images of frozen hydrated TRVP1 in amphipols taken at different defocus levels, 3.1 (a) and 1.5 µm (b) and their Fourier transforms (c, d). Thon rings extend to ~8Å. Dash-line squares or circles indicate representative particles showing two distinctive views. e, 2D class averages of TRPV1 particles. f, Enlarged view of three representative 2D class averages.
Extended Data Figure 5. 3D reconstruction of TRPV1 calculated from TF20 data
a, Gold-standard FSC curve for the 3D reconstruction, marked with resolutions corresponding to FSC = 0.5 and 0.143. b, Side view of the 3D reconstruction low-pass filtered at 9Å and amplified by a temperature factor −1500Å2, showing transmembrane (top) and cytoplasmic (bottom) domains. The transmembrane domain roughly fitted by the atomic model of NavAb (PDB ID: 3RVY). c, Longitudinal cross section view focused on central transmembrane helices. d, Bottom-up view of the 3D reconstruction shows overall structure. e, f, Bottom-up cross section views showing the arrangement of transmembrane (e) and cytoplasmic (f) domains.
Extended Data Figure 6. Motion correction improves the quality of images collected on Polora TF30 microscope using a K2 Summit direct electron detector
a, Fourier transform of a representative cryo-EM image of TRPV1 embedded in a thin layer of vitreous ice over Quantifoil hole without supporting carbon film before motion correction. b, Path of motion of 30 individual subframes, determined as described in Methods. c, d, A nearly perfect Fourier transform (c) was restored after the EM image was corrected for motion (d).
Extended Data Figure 7. Picking and 2D classification of TRPV1 Cryo-EM particles collected on Polora TF30 microscope
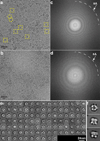
a, Representative cryo-EM image after motion correction. Green boxes indicate all particles that were selected by semi-automatic particle picking and 2D screening, as described in Methods. b, Gallery view of the particles shown in panel a. c, 2D class averages of cryo-EM particles show many fine features (also seen in enlarged views in Fig. 1c), and these features are not visible in the 2D class averages of cryo-EM particles from TF20 data (Supplementary Fig. 4e).
Extended Data Figure 8. 3D reconstruction of TRPV1 calculated from TF30 data
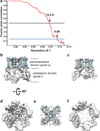
a, Gold-standard FSC curve (red) of the final 3D reconstruction, marked with resolutions corresponding to FSC = 0.5 and 0.143. The FSC curve between the final map and that calculated from the atomic model is shown in blue. The relative low value of this FSC (blue) at low frequency range (> 10Å) is likely due to the presence of amphipol density in the experimental map. b, Euler angle distribution of all particles used for calculating the final 3D reconstruction. The sizes of balls represent the number of particles. The accuracy of rotation is 3.54°, as reported by RELION. c, Different views of the 3D reconstruction low-pass filtered at 6Å and amplified by a temperature factor of −100Å2, fitted with the atomic model of TRPV1. d, Two views of the 3D reconstruction displayed at two different isosurface levels (high in yellow and low in gray). At the low isosurface level, the belt-shaped density of amphipols is visible with a thickness of ~30Å.
Extended Data Figure 9. Cryo-EM densities of selected regions of TRPV1 at 3.4Å resolution
a–d, Representative cryo-EM densities (gray mesh) are superimposed on atomic model (main chain in pink) for various TRPV1 domains, as indicated. e, f, Representative cryo-EM densities (gray mesh) are docked with crystal structure of TRPV1 ankyrin repeats (PDB ID: 2PNN). Accuracy of docking was supported by fitting of several bulky side chains. Map was low-pass filtered to 3.4Å and amplified by a temperature factor −100Å2.
Extended Data Figure 10. Details of domain interactions and outer pore configurations
a–d, Cryo-EM densities (gray mesh) of highlighted regions of TRPV1, as indicated, at 3.4Å resolution are superimposed onto atomic model. Map was low-pass filtered to 3.4Å and amplified by a temperature factor −100Å2. e, Superimposition of TRPV1 (salmon) with Kv1.2/2.1 chimera (PDB ID: 2R9R; grey). f, Superimposition of TRPV1 (salmon) with NavAb (PDB ID: 3RVY; blue). In each case, substantial structural differences are observed in the outer pore region. Structural alignments are based on the pore domain (S5-P-S6).
Comment in
- Structural biology: Ion channel seen by electron microscopy.
Henderson R. Henderson R. Nature. 2013 Dec 5;504(7478):93-4. doi: 10.1038/504093a. Nature. 2013. PMID: 24305155 No abstract available.
Similar articles
- The region adjacent to the C-end of the inner gate in transient receptor potential melastatin 8 (TRPM8) channels plays a central role in allosteric channel activation.
Taberner FJ, López-Córdoba A, Fernández-Ballester G, Korchev Y, Ferrer-Montiel A. Taberner FJ, et al. J Biol Chem. 2014 Oct 10;289(41):28579-94. doi: 10.1074/jbc.M114.577478. Epub 2014 Aug 25. J Biol Chem. 2014. PMID: 25157108 Free PMC article. - Determining the Crystal Structure of TRPV6.
Saotome K, Singh AK, Sobolevsky AI. Saotome K, et al. In: Kozak JA, Putney JW Jr, editors. Calcium Entry Channels in Non-Excitable Cells. Boca Raton (FL): CRC Press/Taylor & Francis; 2018. Chapter 14. In: Kozak JA, Putney JW Jr, editors. Calcium Entry Channels in Non-Excitable Cells. Boca Raton (FL): CRC Press/Taylor & Francis; 2018. Chapter 14. PMID: 30299652 Free Books & Documents. Review. - Cryo-electron microscopy structure of the TRPV2 ion channel.
Zubcevic L, Herzik MA Jr, Chung BC, Liu Z, Lander GC, Lee SY. Zubcevic L, et al. Nat Struct Mol Biol. 2016 Feb;23(2):180-186. doi: 10.1038/nsmb.3159. Epub 2016 Jan 18. Nat Struct Mol Biol. 2016. PMID: 26779611 Free PMC article. - Structure of TRPV1 channel revealed by electron cryomicroscopy.
Moiseenkova-Bell VY, Stanciu LA, Serysheva II, Tobe BJ, Wensel TG. Moiseenkova-Bell VY, et al. Proc Natl Acad Sci U S A. 2008 May 27;105(21):7451-5. doi: 10.1073/pnas.0711835105. Epub 2008 May 19. Proc Natl Acad Sci U S A. 2008. PMID: 18490661 Free PMC article. - Single particle electron cryo-microscopy of a mammalian ion channel.
Liao M, Cao E, Julius D, Cheng Y. Liao M, et al. Curr Opin Struct Biol. 2014 Aug;27:1-7. doi: 10.1016/j.sbi.2014.02.005. Epub 2014 Mar 25. Curr Opin Struct Biol. 2014. PMID: 24681231 Free PMC article. Review.
Cited by
- Evolutionary dynamics of metazoan TRP channels.
Kadowaki T. Kadowaki T. Pflugers Arch. 2015 Oct;467(10):2043-53. doi: 10.1007/s00424-015-1705-5. Epub 2015 Apr 1. Pflugers Arch. 2015. PMID: 25823501 Review. - Near-atomic resolution for one state of F-actin.
Galkin VE, Orlova A, Vos MR, Schröder GF, Egelman EH. Galkin VE, et al. Structure. 2015 Jan 6;23(1):173-182. doi: 10.1016/j.str.2014.11.006. Epub 2014 Dec 18. Structure. 2015. PMID: 25533486 Free PMC article. - Structural biology and molecular pharmacology of voltage-gated ion channels.
Huang J, Pan X, Yan N. Huang J, et al. Nat Rev Mol Cell Biol. 2024 Nov;25(11):904-925. doi: 10.1038/s41580-024-00763-7. Epub 2024 Aug 5. Nat Rev Mol Cell Biol. 2024. PMID: 39103479 Review. - Structural basis of TRPV1 inhibition by SAF312 and cholesterol.
Fan J, Ke H, Lei J, Wang J, Tominaga M, Lei X. Fan J, et al. Nat Commun. 2024 Aug 6;15(1):6689. doi: 10.1038/s41467-024-51085-3. Nat Commun. 2024. PMID: 39107321 Free PMC article. - TRPA1 as a drug target--promise and challenges.
Chen J, Hackos DH. Chen J, et al. Naunyn Schmiedebergs Arch Pharmacol. 2015 Apr;388(4):451-63. doi: 10.1007/s00210-015-1088-3. Epub 2015 Feb 3. Naunyn Schmiedebergs Arch Pharmacol. 2015. PMID: 25640188 Free PMC article. Review.
References
- Ramsey IS, Delling M, Clapham DE. An introduction to TRP channels. Annu Rev Physiol. 2006;68:619–647. - PubMed
- Nilius B, Owsianik G. Transient receptor potential channelopathies. Pflugers Arch. 2010;460:437–450. - PubMed
- Long SB, Campbell EB, Mackinnon R. Crystal structure of a mammalian voltage-dependent Shaker family K+ channel. Science. 2005;309:897–903. - PubMed
Publication types
MeSH terms
Substances
Grants and funding
- R01NS047723/NS/NINDS NIH HHS/United States
- R01 NS047723/NS/NINDS NIH HHS/United States
- R01 NS065071/NS/NINDS NIH HHS/United States
- R01NS065071/NS/NINDS NIH HHS/United States
- R01 GM098672/GM/NIGMS NIH HHS/United States
- S10RR026814/RR/NCRR NIH HHS/United States
- R01GM098672/GM/NIGMS NIH HHS/United States
- S10 RR026814/RR/NCRR NIH HHS/United States
LinkOut - more resources
Full Text Sources
Other Literature Sources
Molecular Biology Databases


