CD4(+) T Cell-Receptor Repertoire Diversity is Compromised in the Spleen but Not in the Bone Marrow of Aged Mice Due to Private and Sporadic Clonal Expansions - PubMed (original) (raw)
CD4(+) T Cell-Receptor Repertoire Diversity is Compromised in the Spleen but Not in the Bone Marrow of Aged Mice Due to Private and Sporadic Clonal Expansions
Eric Shifrut et al. Front Immunol. 2013.
Abstract
Reduction in T cell receptor (TCR) diversity in old age is considered as a major cause for immune complications in the elderly population. Here, we explored the consequences of aging on the TCR repertoire in mice using high-throughput sequencing (TCR-seq). We mapped the TCRβ repertoire of CD4+ T cells isolated from bone marrow (BM) and spleen of young and old mice. We found that TCRβ diversity is reduced in spleens of aged mice but not in their BM. Splenic CD4+ T cells were also skewed toward an effector memory phenotype in old mice, while BM cells preserved their memory phenotype with age. Analysis of Vβ and Jβ gene usage across samples, as well as comparison of CDR3 length distributions, showed no significant age dependent changes. However, comparison of the frequencies of amino-acid (AA) TCRβ sequences between samples revealed repertoire changes that occurred at a more refined scale. The BM-derived TCRβ repertoire was found to be similar among individual mice regardless of their age. In contrast, the splenic repertoire of old mice was not similar to those of young mice, but showed an increased similarity with the BM repertoire. Each old-mouse had a private set of expanded TCRβ sequences. Interestingly, a fraction of these sequences was found also in the BM of the same individual, sharing the same nucleotide sequence. Together, these findings show that the composition and phenotype of the CD4+ T cell BM repertoire are relatively stable with age, while diversity of the splenic repertoire is severely reduced. This reduction is caused by idiosyncratic expansions of tens to hundreds of T cell clonotypes, which dominate the repertoire of each individual. We suggest that these private and abundant clonotypes are generated by sporadic clonal expansions, some of which correspond to pre-existing BM clonotypes. These organ- and age-specific changes of the TCRβ repertoire have implications for understanding and manipulating age-associated immune decline.
Keywords: CD4+ T cells; TCR repertoire; TCR-seq; aging; clonal dominance; high throughput sequencing; immune niche.
Figures
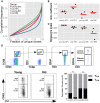
Figure 1
TCRβ repertoire is less diverse in the spleens of old mice. (A) Skewness of the TCRβ repertoire for CD4+ T cells from spleen and BM of young and aged mice. For each mouse, clonotypes were ordered by frequency. We then compared the cumulative frequency at each rank (normalized to sample size). From the curves, which represent the mean for each group, we observe that old SPL has the most skewed repertoire. (B) Gini coefficient per group. Horizontal lines represent the mean for each group and dots are individual samples. Old SPL group has the highest values, thus it is the most skewed. (C) Simpson’s diversity index calculated for each mouse (dots). Horizontal lines represent the mean for each group. The old SPL group has a significantly lower diversity than the young SPL group. (D) Phenotypic changes of CD4+ memory T cells in aging. Top panels show flow cytometric gating strategy. Old spleen samples have significantly higher percentage of effector memory T cells compared to young spleen samples (bottom panels and bar graph). BM samples have similar central/effector memory ratios across age groups (mean ± SE of each group (n = 4–5 per group; **P < 0.01; Student’s t test).
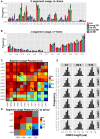
Figure 2
Vβ and Jβ usage in aged mice. (A,B) Each bar represents the mean frequency of a gene segment in that group of mice. Error bars are SEM. (C) Pairwise correlations of Vβ and Jβ usage between all pairs of mice. We observe higher correlations between mice in Jβ usage (upper triangle) compared to Vβ usage (lower triangle). (D) Correlation of the gene segment usage between all pairs of mice averaged over groups. We detect a general high correlation in the data, with inter-tissue similarity across age groups. BM = bone marrow, SPL = spleen, n = 3 for all groups. (E) “Virtual” spectratypes. Each bar represents the relative frequency of a particular CDR3 length (in amino acids) for three representative Vβ segments, stated above each panel, measured across individual SPL samples. No significant changes could be detected in CDR3 length distributions across age groups.
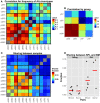
Figure 3
Comparison of the TCR repertoires in different tissues and age groups at the level of AA clonotypes. (A) For each pair of mice, we calculated the Spearman’s correlation for frequencies of clonotypes that are shared by that pair. As the frequency distribution of TCR repertoire is over-dispersed, we used the log-transformed values as input for the rank correlation test. The BM groups have high similarity between the samples, and also between age groups. (B) For each group of mice (n = 3), we averaged the correlation scores of (A). Scores along the diagonal indicate the intra-group similarity. Again, the homogeneity in the BM samples within groups and across age is evident. In addition, the repertoire of the old SPL group has a higher correlation with the young BM and old BM groups, and a low intra-group correlation. (C) Sharing of clones between samples. From each sample, we randomly chose 300 AA clones and calculated pairwise sharing. The values represent the fraction of the sample that is shared between any particular pair, averaged over 100 iterations. BM repertoires show high level of sharing between individual mice and across age groups. (D) A comparison of sharing between BM and SPL repertoires within the same animal or from different animals (Mixed).
Figure 4
The TCRβ repertoire of old mice is shaped by private clonal expansions. (A) Top 300 ranking AA clonotypes from all samples (total of 2,108 clonotypes) were clustered using Euclidian distance. Paired samples from the same animal are adjacent to each other. In old SPL there are subsets of enriched clones, which are unique to each mouse. Also, part of that subset is present in high frequency in the matching BM sample from the same animal (black frames). (B) Frequencies of four selected AA clonotypes across all samples. Stacked bars show the nt sequences, uniquely colored, that encode the AA sequence stated above the panel. Top 3 panels show representative clonotypes that are expanded and private in SPL and BM of old mice. Remarkably, these AA sequences are encoded by the same nt sequence in the spleen and BM of these animals. The bottom panel shows a typical abundant AA clonotype in young SPL samples, showing a high level of convergent recombination across most samples in which it is found. (C) Sharing of top 300 nt sequences between SPL and BM of the same animal. For each mouse, we calculated the number of exclusively shared nt sequences. The Venn diagram (left) shows an example in which 44 sequences are exclusively shared by BM and SPL of old mouse #1, and are not found in any other sample. Bar plot (right) shows that there are on average more exclusively shared nt sequences within SPL and BM of the same animal in old mice compared to young mice. Error bars indicate standard error. (D) Evaluation of clonal dominance. Bars show the average ratio between the frequency of the most frequent and the least frequent nt sequence encoding for the same AA sequence. Values were calculated for the top 300 AA clonotypes from each sample. The ratio is significantly higher in old SPL samples compared to young SPL (p < 0.05, Student’s t test), suggesting clonal dominance. (E) Convergent recombination (# of nt sequences encoding each AA sequence) of AA clonotypes is plotted against their frequency. In old SPL the scatter shows a subset of high frequency clones that are encoded by less than 10 nt sequences (lower-right quadrant). In contrast, in young SPL many clonotypes show high convergent recombination (upper-left quadrant).
Similar articles
- High-throughput sequencing reveals restricted TCR Vβ usage and public TCRβ clonotypes among pancreatic lymph node memory CD4(+) T cells and their involvement in autoimmune diabetes.
Marrero I, Aguilera C, Hamm DE, Quinn A, Kumar V. Marrero I, et al. Mol Immunol. 2016 Jun;74:82-95. doi: 10.1016/j.molimm.2016.04.013. Epub 2016 May 6. Mol Immunol. 2016. PMID: 27161799 Free PMC article. - Next-Generation Sequencing Analysis of the Human TCRγδ+ T-Cell Repertoire Reveals Shifts in Vγ- and Vδ-Usage in Memory Populations upon Aging.
Kallemeijn MJ, Kavelaars FG, van der Klift MY, Wolvers-Tettero ILM, Valk PJM, van Dongen JJM, Langerak AW. Kallemeijn MJ, et al. Front Immunol. 2018 Mar 6;9:448. doi: 10.3389/fimmu.2018.00448. eCollection 2018. Front Immunol. 2018. PMID: 29559980 Free PMC article. - High-throughput sequencing of CD4+ T cell repertoire reveals disease-specific signatures in IgG4-related disease.
Wang L, Zhang P, Li J, Lu H, Peng L, Ling J, Zhang X, Zeng X, Zhao Y, Zhang W. Wang L, et al. Arthritis Res Ther. 2019 Dec 19;21(1):295. doi: 10.1186/s13075-019-2069-6. Arthritis Res Ther. 2019. PMID: 31856905 Free PMC article. - Application of the molecular analysis of the T-cell receptor repertoire in the study of immune-mediated hematologic diseases.
Plasilova M, Risitano A, Maciejewski JP. Plasilova M, et al. Hematology. 2003 Jun;8(3):173-81. doi: 10.1080/1024533031000107505. Hematology. 2003. PMID: 12745651 Review. - Narrowing the Gap: Preserving Repertoire Diversity Despite Clonal Selection during the CD4 T Cell Response.
Merkenschlager J, Kassiotis G. Merkenschlager J, et al. Front Immunol. 2015 Aug 11;6:413. doi: 10.3389/fimmu.2015.00413. eCollection 2015. Front Immunol. 2015. PMID: 26322045 Free PMC article. Review.
Cited by
- Single cell analysis revealed that two distinct, unique CD4+ T cell subsets were increased in the small intestinal intraepithelial lymphocytes of aged mice.
Yonemoto Y, Nemoto Y, Morikawa R, Shibayama N, Oshima S, Nagaishi T, Mizutani T, Ito G, Fujii S, Okamoto R. Yonemoto Y, et al. Front Immunol. 2024 Jan 22;15:1340048. doi: 10.3389/fimmu.2024.1340048. eCollection 2024. Front Immunol. 2024. PMID: 38327516 Free PMC article. - IgD+ age-associated B cells are the progenitors of the main T-independent B cell response to infection that generates protective Ab and can be induced by an inactivated vaccine in the aged.
Kugler-Umana O, Zhang W, Kuang Y, Liang J, Castonguay CH, Tonkonogy SL, Marshak-Rothstein A, Devarajan P, Swain SL. Kugler-Umana O, et al. Aging Cell. 2022 Oct;21(10):e13705. doi: 10.1111/acel.13705. Epub 2022 Sep 2. Aging Cell. 2022. PMID: 36056604 Free PMC article. - Understanding the Heterogeneous Population of Age-Associated B Cells and Their Contributions to Autoimmunity and Immune Response to Pathogens.
Kugler-Umana O, Devarajan P, Swain SL. Kugler-Umana O, et al. Crit Rev Immunol. 2020;40(4):297-309. doi: 10.1615/CritRevImmunol.2020034934. Crit Rev Immunol. 2020. PMID: 33426819 Free PMC article. - Single-cell lineage mapping of a diverse virus-specific naive CD4 T cell repertoire.
Khatun A, Kasmani MY, Zander R, Schauder DM, Snook JP, Shen J, Wu X, Burns R, Chen YG, Lin CW, Williams MA, Cui W. Khatun A, et al. J Exp Med. 2021 Mar 1;218(3):e20200650. doi: 10.1084/jem.20200650. J Exp Med. 2021. PMID: 33201171 Free PMC article. - Developing an Unbiased Multiplex PCR System to Enrich the TRB Repertoire Toward Accurate Detection in Leukemia.
Wu J, Wang X, Lin L, Li X, Liu S, Zhang W, Luo L, Wan Z, Fang M, Zhao Y, Wang X, Mai H, Yuan X, Wen F, Li C, Liu X. Wu J, et al. Front Immunol. 2020 Aug 6;11:1631. doi: 10.3389/fimmu.2020.01631. eCollection 2020. Front Immunol. 2020. PMID: 32849555 Free PMC article.
References
- Naylor K, Li G, Vallejo AN, Lee W-W, Koetz K, Bryl E, et al. The influence of age on T cell generation and TCR diversity. J Immunol (2005) 174:7446–52 - PubMed
- Kang I, Hong MS, Nolasco H, Park SH, Dan JM, Choi J-Y, et al. Age-associated change in the frequency of memory CD4+ T cells impairs long term CD4+ T cell responses to influenza vaccine. J Immunol (2004) 173:673–81 - PubMed
LinkOut - more resources
Full Text Sources
Other Literature Sources
Research Materials


