Hypoxia-inducible factors mediate coordinated RhoA-ROCK1 expression and signaling in breast cancer cells - PubMed (original) (raw)
Hypoxia-inducible factors mediate coordinated RhoA-ROCK1 expression and signaling in breast cancer cells
Daniele M Gilkes et al. Proc Natl Acad Sci U S A. 2014.
Retraction in
- Retraction for Gilkes et al., Hypoxia-inducible factors mediate coordinated RhoA-ROCK1 expression and signaling in breast cancer cells.
[No authors listed] [No authors listed] Proc Natl Acad Sci U S A. 2022 Sep 20;119(38):e2213288119. doi: 10.1073/pnas.2213288119. Epub 2022 Sep 2. Proc Natl Acad Sci U S A. 2022. PMID: 36053739 Free PMC article. No abstract available.
Abstract
Overexpression of Rho kinase 1 (ROCK1) and the G protein RhoA is implicated in breast cancer progression, but oncogenic mutations are rare, and the molecular mechanisms that underlie increased ROCK1 and RhoA expression have not been determined. RhoA-bound ROCK1 phosphorylates myosin light chain (MLC), which is required for actin-myosin contractility. RhoA also activates focal adhesion kinase (FAK) signaling. Together, these pathways are critical determinants of the motile and invasive phenotype of cancer cells. We report that hypoxia-inducible factors coordinately activate RhoA and ROCK1 expression and signaling in breast cancer cells, leading to cell and matrix contraction, focal adhesion formation, and motility through phosphorylation of MLC and FAK. Thus, intratumoral hypoxia acts as an oncogenic stimulus by triggering hypoxia-inducible factor → RhoA → ROCK1 → MLC → FAK signaling in breast cancer cells.
Keywords: cytoskeletal reprogramming; metastasis; migration; oxygen; tumor microenvironment.
Conflict of interest statement
The authors declare no conflict of interest.
Figures
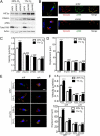
Fig. 1.
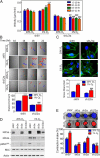
HIFs mediate increased cell motility, the formation of stress fibers, and matrix contraction by hypoxic breast cancer cells. (A) Cell velocity over 4-h intervals was determined for MDA-MB-231 subclones, which were stably transfected with empty vector (shEV) or expression vectors encoding shRNA against HIF-1α and HIF-2α (sh1/2α), plated on a 2D collagen-coated substratum, and exposed to 20% or 1% O2 for 22 h. Data shown are mean ± SEM; n = 50 cells; **P < 0.01, ***P < 0.001 vs. shEV cells at 20% O2 at the corresponding time point; ##P < 0.01, ###P < 0.001 vs. shEV cells at 1% O2 at the corresponding time point (two-way ANOVA with Bonferroni posttest). (B) (Upper) Representative cell trajectories are shown for the indicated subclone, O2 concentration, and time point. (Lower) Maximum displacement from the origin (mean ± SEM) was determined for cells analyzed in A. ***P < 0.001 vs. shEV cells at 20% O2; ###P < 0.001 vs. shEV cells at 1% O2 (two-way ANOVA with Bonferroni posttest). (C) (Upper) MDA-MB-231 subclones were exposed to 20% or 1% O2 for 24 h and stained with FITC-conjugated phalloidin (green) to detect F-actin (stress fibers) and with DAPI to detect nuclei (blue). (Lower) The number of stress fibers per cell is shown. Data are shown as mean ± SEM; n = 10 cells. ***P < 0.001 vs. shEV cells at 20% O2; ###P < 0.001 vs. shEV cells at 1% O2 (two-way ANOVA with Bonferroni posttest). (D) Immunoblot assays were performed to quantify levels of HIF-1α, HIF-2α, total MLC, pMLCS19, and actin following exposure to 20% or 1% O2 for 24 h. (E) (Upper) Area of MDA-MB-231 cell-embedded collagen gels following exposure to 20% or 1% O2 for 18 h. (Lower) The contraction index was calculated as A(_t_0) − A(_t_18)]/A(_t_0) × 100% where A(_t_0) and A(_t_18) are the gel area at the start and the end of the experiment, respectively. Data are shown as mean ± SEM; n = 3 gels.***P < 0.001 vs. shEV cells at 20% O2; ###P < 0.001, #P < 0.05 vs. shEV cells at 1% O2 (two-way ANOVA with Bonferroni posttest).
Fig. 2.
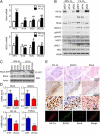
Hypoxia induces RhoA and ROCK1 expression and MLC phosphorylation. (A) qRT-PCR was performed to quantify RhoA (Upper) and ROCK1 (Lower) mRNA levels in breast cell lines following exposure to 20% or 1% O2 for 24 h. Data are shown as mean ± SEM; n = 3. *P < 0.05, **P < 0.01, ***P < 0.001 vs. 20% O2 (Student's t test). For each sample, the expression of RhoA or ROCK1 mRNA was quantified relative to 18_S_ rRNA and then normalized to the result obtained from MCF-10A cells at 20% O2. Statistical analysis was performed before normalization. (B) Immunoblot assays were performed to quantify HIF-1α, HIF-2α, total RhoA, ROCK1, MYPT, MLC, pMYPTT853, and pMLCS19 protein levels in breast cell lines following exposure to 20% O2 (−) or 1% O2 (+) for 48 h. (C and D) Kaplan–Meier analysis of disease-specific survival for breast cancer patients stratified by RhoA, ROCK1, ROCK2, or combined RhoA and ROCK1 mRNA expression in a 159-patient data set (40) (C) and an 82-patient data set (41) (D). Low = patients with mRNA levels less than the median. High = patients with mRNA levels greater than the median. Low, Low = patients with RhoA and ROCK1 mRNA levels less than the median. Low, High = patients with RhoA or ROCK1 mRNA greater than the median and the other mRNA less than the median. High, High = patients with RhoA and ROCK1 mRNA levels greater than the median. A Wilcoxon rank sum test was used to compare survival curves. *P < 0.05; **P < 0.01; ***P < 0.001; ns, not significant.
Fig. 3.
Hypoxia-induced expression of RhoA and ROCK1 is HIF dependent. (A) qRT-PCR was performed to quantify RhoA (Upper) and ROCK1 (Lower) mRNA levels in MDA-MB-231 subclones exposed to 20% or 1% O2 for 24 h. Data are shown as mean ± SEM; n = 3. ***P < 0.001 vs. shEV cells at 20% O2; #P < 0.05, ##P < 0.01, ###P < 0.001 vs. shEV cells at 1% O2 (two-way ANOVA with Bonferroni posttest). (B) Immunoblot assays were performed to quantify total RhoA, ROCK1, MYPT, MLC, pMYPTT853 (pMYPT, Upper), pMYPTT696 (pMYPT, Lower), and pMLCS19 protein levels in cells exposed to 20% or 1% O2 for 48 h. (C) Cells were exposed to 20% or 1% O2 for 24 h, and whole-cell lysates (WCL) were incubated with GST-Rhotekin fusion protein, which interacts only with GTP-bound RhoA, and glutathione agarose beads. GTP-bound RhoA was eluted and analyzed by immunoblot assay. RhoA and actin levels in the input whole-cell lysate also were determined. (D and E) MDA-MB-231 subclones were injected into the mammary fat pad of SCID mice. Tumors were harvested on day 52. (D) qRT-PCR was performed to quantify RhoA, ROCK1, P4HA1, and HIF-1α mRNA levels in shEV and sh1/2α tumors, and values were normalized to shEV. Data are shown as mean ± SEM; n = 5 mice. *P < 0.05, **P < 0.01 vs. shEV (Student's t test). (E) (Top Three Rows) Immunohistochemistry was performed to detect ROCK1, RhoA, and HIF-1α in MDA-MB-231 shEV serial tumor sections, which were imaged at increasing magnification as indicated. In the top row, fields were imaged in a 3 × 3 array, and the array was stitched to obtain a large view of the tumor section. (Bottom Row) Staining was pseudocolored and merged to show colocalization.
Fig. 4.
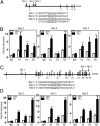
HIF-1 and HIF-2 bind directly to the RHOA and ROCK1 genes in hypoxic cells. (A) Three HIF binding sites in the 5′-flanking region and intron 1 of the human RHOA gene were identified by ChIP as described below. (B) MDA-MB-231 cells were incubated at 20% or 1% O2 for 16 h, and ChIP assays were performed using IgG or antibodies against HIF-1α, HIF-2α, or HIF-1β. Primers flanking binding sites were used for qPCR, and values were normalized to cells exposed to 20% O2 and ChIP with IgG. Data are shown as mean ± SEM; n = 3. *P < 0.05, **P < 0.01, ***P < 0.001 vs. 20% O2 (Student’s t test). (C and D) HIF binding sites were identified in intron 1, intron 28, and intron 32 of the ROCK1 gene (C) by ChIP (D), using the immunoprecipitates described above.
Fig. 5.
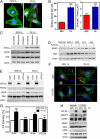
RhoA/ROCK1 signaling stimulates the formation of focal adhesions in hypoxic cells. (A) MDA-MB-231 cells were exposed to 20% or 1% O2 for 24 h and were stained with FITC-phalloidin to detect F-actin stress fibers (green), with anti-vinculin antibodies to detect focal adhesions (red), and with DAPI, to detect nuclei (blue). (B) (Left) The number of stress fibers per cell was quantified based on F-actin staining. Data are shown as mean ± SEM; n = 50 cells. ***P < 0.001 vs. 20% O2 (Student's t test). (Right) The focal adhesion area was determined based on vinculin staining. Data are shown as mean ± SEM; n = 50 cells. ***P < 0.001 vs. 20% O2 (Student's t test). (C) Immunoblot assays were performed to quantify levels of HIF-1α, pFAKT397, and total FAK protein levels in MDA-MB-231 cells cultured on uncoated, fibronectin-coated, or type I collagen-coated plates and exposed to 20% or 1% O2 for 24 h. (D and E) Immunoblot assays were performed to quantify pFAKT397 and total FAK in breast cell lines (D) and MDA-MB-231 subclones (E) following exposure to 20% or 1% O2 for 24 h. (F) MDA-MB-231 subclones were exposed to 20% or 1% O2 for 24 h and were stained with FITC-phalloidin (F-actin; green), anti-pFAKT397 (focal adhesions; red), and DAPI (nuclei; blue). (G) Image analysis was performed to determine the focal adhesion (FA) density per cell. Data are shown as mean ± SEM; n = 50 cells. ***P < 0.001 vs. shEV cells at 20% O2; #P < 0.05, ##P < 0.01, ###P < 0.001 vs. shEV cells at 1% O2 (two-way ANOVA with Bonferroni posttest). (H) Immunoblot assays were performed for HIF-1α, pMYPTT853, total MYPT, pMLCS19, total MLC, pFAKT397, and total FAK protein levels in MDA-MB-231 cells treated with vehicle or the ROCK inhibitor Y-27632 during exposure to 20% or 1% O2 for 24 h.
Fig. 6.
Hypoxia-induced motility requires the formation of focal adhesions and FAK activity. (A) MDA-MB-231 subclones stably expressing either of two independent shRNAs against FAK (shFAK1 or shFAK2) were exposed to 20% or 1% O2 for 24 h, and immunoblot assays were performed. (B) MDA-MB-231 subclones were exposed to 20% or 1% O2 for 24 h and stained with antibodies against vinculin (red) and pFAKT397 (green); colocalization (yellow) is observed in the merge image. A magnified view of the photomicrographs is shown on the left. (C) The velocity of subclones migrating on collagen-coated surfaces during 14–24 h of exposure to 20% or 1% O2 was determined. Data are shown as mean ± SEM; n = 50. ***P < 0.001 vs. shEV cells at 20% O2; ###P < 0.001 vs. shEV cells at 1% O2 (two-way ANOVA with Bonferroni posttest). (D) The maximum displacement of each cell was determined and is shown as mean ± SEM, n = 50. ***P < 0.001 vs. shEV cells at 20% O2; ###P < 0.001 vs. shEV cells at 1% O2 (two-way ANOVA with Bonferroni posttest). (E) Vinculin (red) and pFAKT397 (green) were detected by immunofluorescence in MDA-MB-231 cells plated on soft or stiff polyacrylamide gels following exposure to 20% or 1% O2 for 16 h. (F) Velocity (Upper) and maximum displacement (Lower) of MDA-MB-231 cells migrating on soft or stiff surfaces during 14–24 h of exposure to 20% or 1% O2 were determined. Data are shown as mean ± SEM; n = 50. ***P < 0.001 vs. shEV on the stiff surface at 20% O2; ###P < 0.001 vs. shEV cells on the stiff surface at 1% O2 (two-way ANOVA with Bonferroni posttest).
Fig. 7.
Consequences of coordinate activation of RHOA and ROCK1 by HIFs. Schematic diagram of hypoxia-induced and HIF-regulated RhoA/ROCK1 expression, which inhibits MYPT activity and increases MLC phosphorylation, leading to actin polymerization, cell motility, actin-myosin contractility, and the formation of focal adhesions which promote FAK activation. The pathways converge to promote cell motility, an essential step required for invasion and metastasis. Results from this study show that hypoxia promotes motility through the RhoA → ROCK1 signaling pathway. Blue: transcriptional regulation. Black: signaling mechanisms.
Comment in
- Hypoxia promotes tumor cell motility via RhoA and ROCK1 signaling pathways.
Leong HS, Chambers AF. Leong HS, et al. Proc Natl Acad Sci U S A. 2014 Jan 21;111(3):887-8. doi: 10.1073/pnas.1322484111. Epub 2014 Jan 7. Proc Natl Acad Sci U S A. 2014. PMID: 24398519 Free PMC article. No abstract available.
Similar articles
- Hypoxia promotes tumor cell motility via RhoA and ROCK1 signaling pathways.
Leong HS, Chambers AF. Leong HS, et al. Proc Natl Acad Sci U S A. 2014 Jan 21;111(3):887-8. doi: 10.1073/pnas.1322484111. Epub 2014 Jan 7. Proc Natl Acad Sci U S A. 2014. PMID: 24398519 Free PMC article. No abstract available. - SEPT9_i1 regulates human breast cancer cell motility through cytoskeletal and RhoA/FAK signaling pathway regulation.
Zeng Y, Cao Y, Liu L, Zhao J, Zhang T, Xiao L, Jia M, Tian Q, Yu H, Chen S, Cai Y. Zeng Y, et al. Cell Death Dis. 2019 Sep 26;10(10):720. doi: 10.1038/s41419-019-1947-9. Cell Death Dis. 2019. PMID: 31558699 Free PMC article. - Role of RhoA and its effectors ROCK and mDia1 in the modulation of deformation-induced FAK, ERK, p38, and MLC motogenic signals in human Caco-2 intestinal epithelial cells.
Chaturvedi LS, Marsh HM, Basson MD. Chaturvedi LS, et al. Am J Physiol Cell Physiol. 2011 Nov;301(5):C1224-38. doi: 10.1152/ajpcell.00518.2010. Epub 2011 Aug 17. Am J Physiol Cell Physiol. 2011. PMID: 21849669 Free PMC article. - I told you to stop: obscurin's role in epithelial cell migration.
Shultz KD, Al Anbari YF, Wright NT. Shultz KD, et al. Biochem Soc Trans. 2024 Aug 28;52(4):1947-1956. doi: 10.1042/BST20240564. Biochem Soc Trans. 2024. PMID: 39051125 Review. - RHOA drivers take alternate routes in gastric cancer.
Benton D, Chernoff J. Benton D, et al. Sci Signal. 2023 Dec 19;16(816):eadk9171. doi: 10.1126/scisignal.adk9171. Epub 2023 Dec 19. Sci Signal. 2023. PMID: 38113334 Review.
Cited by
- lncRNA-CCHE1 is involved in migration and invasion but not in proliferation of pancreatic adenocarcinoma cells possibly by interacting with ROCK1.
Jin X, Ye L, Lin M, Gu B, Wang J, He Y, Li W. Jin X, et al. Oncol Lett. 2019 Aug;18(2):1218-1224. doi: 10.3892/ol.2019.10416. Epub 2019 May 30. Oncol Lett. 2019. PMID: 31423182 Free PMC article. - FBXW5 Promotes Tumorigenesis and Metastasis in Gastric Cancer via Activation of the FAK-Src Signaling Pathway.
Yeo MS, Subhash VV, Suda K, Balcıoğlu HE, Zhou S, Thuya WL, Loh XY, Jammula S, Peethala PC, Tan SH, Xie C, Wong FY, Ladoux B, Ito Y, Yang H, Goh BC, Wang L, Yong WP. Yeo MS, et al. Cancers (Basel). 2019 Jun 17;11(6):836. doi: 10.3390/cancers11060836. Cancers (Basel). 2019. PMID: 31213005 Free PMC article. - Cell type-dependent HIF1 α-mediated effects of hypoxia on proliferation, migration and metastatic potential of human tumor cells.
Tátrai E, Bartal A, Gacs A, Paku S, Kenessey I, Garay T, Hegedűs B, Molnár E, Cserepes MT, Hegedűs Z, Kucsma N, Szakács G, Tóvári J. Tátrai E, et al. Oncotarget. 2017 Jul 4;8(27):44498-44510. doi: 10.18632/oncotarget.17806. Oncotarget. 2017. PMID: 28562340 Free PMC article. - Hypoxia impacts human MSC response to substrate stiffness during chondrogenic differentiation.
Foyt DA, Taheem DK, Ferreira SA, Norman MDA, Petzold J, Jell G, Grigoriadis AE, Gentleman E. Foyt DA, et al. Acta Biomater. 2019 Apr 15;89:73-83. doi: 10.1016/j.actbio.2019.03.002. Epub 2019 Mar 4. Acta Biomater. 2019. PMID: 30844569 Free PMC article. - Hypoxia and the modulation of the actin cytoskeleton - emerging interrelations.
Zieseniss A. Zieseniss A. Hypoxia (Auckl). 2014 Mar 25;2:11-21. doi: 10.2147/HP.S53575. eCollection 2014. Hypoxia (Auckl). 2014. PMID: 27774463 Free PMC article. Review.
References
- Jaffe AB, Hall A, Rho GTPases: Biochemistry and biology. Annu Rev Cell Dev Biol 21, 247–269 (2005). - PubMed
- Narumiya S, Tanji M, Ishizaki T, Rho signaling, ROCK and mDia1, in transformation, metastasis and invasion. Cancer Metastasis Rev 28, 65–76 (2009). - PubMed
- Olson MF, Sahai E, The actin cytoskeleton in cancer cell motility. Clin Exp Metastasis 26, 273–287 (2009). - PubMed
- Jacobs M, et al. , The structure of dimeric ROCK I reveals the mechanism for ligand selectivity. J Biol Chem 281, 260–268 (2006). - PubMed
- Amano M, et al. , Phosphorylation and activation of myosin by Rho-associated kinase (Rho-kinase). J Biol Chem 271, 20246–20249 (1996). - PubMed
Publication types
MeSH terms
Substances
Grants and funding
- U54 CA143868/CA/NCI NIH HHS/United States
- T32 CA130840/CA/NCI NIH HHS/United States
- R01 CA174388/CA/NCI NIH HHS/United States
- U54-CA143868/CA/NCI NIH HHS/United States
- T32 CA153952/CA/NCI NIH HHS/United States
LinkOut - more resources
Full Text Sources
Other Literature Sources
Medical
Miscellaneous
