miR-16 and miR-26a target checkpoint kinases Wee1 and Chk1 in response to p53 activation by genotoxic stress - PubMed (original) (raw)
. 2013 Dec 12;4(12):e953.
doi: 10.1038/cddis.2013.483.
N Purmessur 2, A V Antonov 3, T Ivanova 2, E Karpova 2, K Krishan 4, M Ivan 4, V Aksenova 5, D Tentler 5, A V Garabadgiu 5, G Melino 6, N A Barlev 7
Affiliations
- PMID: 24336073
- PMCID: PMC3877554
- DOI: 10.1038/cddis.2013.483
miR-16 and miR-26a target checkpoint kinases Wee1 and Chk1 in response to p53 activation by genotoxic stress
L Lezina et al. Cell Death Dis. 2013.
Abstract
The tumour suppressor p53 is a crucial regulator of cell cycle arrest and apoptosis by acting as a transcription factor to regulate a variety of genes. At least in part, this control is exerted by p53 via regulating expression of numerous microRNAs. We identified two abundantly expressed microRNAs, miR-16 and miR-26a, whose expression is regulated by p53 during the checkpoint arrest induced by the genotoxic drug, doxorubicin. Importantly, among the targets of these miRs are two critical checkpoint kinases, Chk1 and Wee1. The p53-dependent augmentation of miR-16 and miR-26a expression levels led to the cell cycle arrest of tumour cells in G1/S and increased apoptosis. Strikingly, the bioinformatics analysis of survival times for patients with breast and prostate cancers has revealed that co-expression of mir-16 and miR-26a correlated with a better survival outcome. Collectively, our data provide a novel mechanism whereby p53 represses Chk1 and Wee1 expression, at least partially, via upregulation of miR-16 and miR-26a and thus sensitizes tumour cells to genotoxic therapies.
Figures
Figure 1
Expression of miR-16 and miR-26a is induced in the presence of p53 by doxorubicin. (a) Comparison of the p53 levels in U2-OS cells stably expressing scrambled shRNA versus p53-specific shRNA (U2-OS KDp53) on treatment with doxorubicin. U2-OS cells with wild type and knocked-down expression of p53 were continuously treated with 0.5 _μ_M of doxorubicin for 0, 6, and 12 h before harvesting. Cell lysates were then prepared and analysed by western blotting using p53-speicific antibody. Anti-tubulin serum was used as loading control. (b) Cell cycle distribution of U2-OS cells with wild type and knocked-down expression of p53 on doxorubicin treatment. Both cell types were treated with 0.5 _μ_M of doxorubicin for 12 h, fixed with formaldehyde and stained with propidium iodine for subsequent cell cycle analysis. The same cells were treated with doxorubicin for 24 h and total RNA was extracted, converted to cDNA and analysed by real-time PCR for expression levels of miR-16 (c); miR-26a (d), and p21, as a positive control (e)
Figure 2
p53 and doxorubicin treatment activate promoters of miR-16-2 and miR-26a genes in luciferase assay. (a) Shown is the scheme of the promoter and its deletion mutant for the miR-26a-1 gene situated in front of the luciferase gene. U2-OS cells stably expressing scrambled shRNA (U2-OS scr) versus p53-specific shRNA (U2-OS KDp53) were treated or not treated with doxorubicin for 14 h before harvesting. Cell extracts were then prepared, normalized for transfection efficiency by measuring beta-galactosidase activity and assayed for luciferase activity. Empty luciferase vector with minimal HSP70 promoter was used as negative control. (b) Shown are three fragments of the miR-16-2 promoter, which were assayed for their ability to drive luciferase activity in response to doxorubicin. Cells were treated and assayed as described above. A fragment of the miR-16-1 promoter driving transcription of the luciferase gene that does not respond to p53 was used as a negative control
Figure 3
Analysis of p53 binding to the regulatory regions of miR-16-2 and miR-26a genes by ChIP assay. (a) Shown is the scheme of the miR-26a-1 regulatory region. Putative p53-binding sites are depicted. Positions of nucleotides are given in respect to the transcription start site. (b) A summary of results of ChIP assay for p53 biniding on U2-OS scr (WT) and U2-OS shRNA-p53 (KD) cells. Cells were non-treated or treated for 24 h with doxorubicin and analysed for p53 binding to different amplicons of the sequence of the miR-26a-1 gene. (c) ChIP assay of Drosha and (d) p68 binding to the region −1500, where maximal p53 binding was detected. (e) Shown is the scheme of the SMC4 gene with intronic regulatory region for miR-16-2. (f) ChIP assay of p53 binding in the promoter of SMC4 gene and (G) in the upstream sequence of miR-16-2
Figure 4
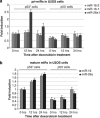
p53 differentially affects expression of primary and mature miR-16-2 and miR-26a. Effect of p53 activation by doxorubicin on the transcription of primary miR-16-1, miR-16-2, and miR-26a-1 gene in p53+ and p53− U2-OS cells was measured by Q-RT-PCR. Levels of pri-miRs expression were normalized to the signal of U6 RNA. (b) Shown are the expression levels of mature (transcription-independent) miR-16 and miR-26a, relative to U6
Figure 5
Chk1 and Wee1 are the targets of p53-dependent miR-16 and miR-26a. (a) Effect of miR-16 overexpression alone or together with its antago-miR (inhibitor) on expression levels of Chk1 and cyclin E was assessed by western blotting using specific antibodies. Beta-tubulin was used as a loading control. (b) Effect of individual or simultaneous overexpression of miR-16 and miR-26a on expression levels of Wee1 and Chk1 in H1299 cells. Expression levels of Wee1 and Chk1 in the cells transfected with control oligo were arbitrarily set as 1. Intensities of bands corresponding to the Wee1 and Chk1 proteins were calculated using ImageQuant software. (c) To determine the effect of p53 activation on cellular levels of the Chk1 and Wee1 proteins isogenic HCT116 cell lines with different p53 status were treated with doxorubicin for 16 h followed by western blotting against the respective proteins. Note, that anti-p53 antibody gave a non-specific band in samples prepared from p53-deficient cells. (d) Shown are the regions of homology between Wee1 and Chk1 3-UTRs and miR-16 and miR-26a sequences. (e) A schematic presentation of putative miR-16- and miR-26a-binding sites in the 3-UTR regions of Chk1 and Wee1. Below are shown the results of luciferase assay in which the activities of 3-UTRs of Chk1 and Wee1 fused to the luciferase gene constructs were measured in the presence of individually or simultaneously expressed miR-16 and/or miR-26a. Binding of these miRs to 3-UTRs of the respective genes should result in repression of the protein synthesis and hence decrease luciferase activity. Fold repression was calculated against the value of luciferase activity of the cells transfected with respective vectors in the absence of miRs, which was set as 1
Figure 6
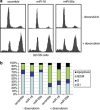
Cell cycle analysis of U2-OS cells transfected with scramble, miR-16, and miR-26a oligonucleotides. (a) Cell cycle profiles of U2-OS cells transfected with indicated miR oligos in the absence or presence of 0.5 _μ_M doxorubicin. Following transfection, the cells were treated with doxorubicin for 14 h before fixing with methanol and staining with propidium iodine. (b) Graphic representation of the results shown in a
Figure 7
A bioinformatics analysis of the effect of Chk1, Wee1, miR-16 and miR-26a expression on survival rates for both breast and prostate cancer patients. The two upper panels show correlations between the levels of expression of Chk1 and Wee1 and survival rates of breast cancer patients. The two middle and two bottom panels show correlations between miR-16 and miR-26a levels of expression and the survival rates of breast and prostate cancer patients, respectively
Figure 8
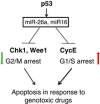
A schematic model of how p53 via activation of miR-26a and miR-16 promotes G1/S arrest and apoptosis in response to genotoxic drugs. On the one hand, miR-16 and 26a downregulate G2/M checkpoint kinases, Chk1 and Wee1, resulting in slippage of damaged cancer cells from the mitotic checkpoint arrest and their elimination via apoptosis. On the other hand, miR-16 represses expression of several cell cycle promoting genes, including cyclin E, cyclin D, cdk4 and cdk6 resulting in their arrest in G1/S, which subsequently elicits apoptosis
Similar articles
- Chk1 and Wee1 control genotoxic-stress induced G2-M arrest in melanoma cells.
Vera J, Raatz Y, Wolkenhauer O, Kottek T, Bhattacharya A, Simon JC, Kunz M. Vera J, et al. Cell Signal. 2015 May;27(5):951-60. doi: 10.1016/j.cellsig.2015.01.020. Epub 2015 Feb 12. Cell Signal. 2015. PMID: 25683911 - 90-kDa heat shock protein inhibition abrogates the topoisomerase I poison-induced G2/M checkpoint in p53-null tumor cells by depleting Chk1 and Wee1.
Tse AN, Sheikh TN, Alan H, Chou TC, Schwartz GK. Tse AN, et al. Mol Pharmacol. 2009 Jan;75(1):124-33. doi: 10.1124/mol.108.050807. Epub 2008 Sep 26. Mol Pharmacol. 2009. PMID: 18820127 Free PMC article. - A regimen combining the Wee1 inhibitor AZD1775 with HDAC inhibitors targets human acute myeloid leukemia cells harboring various genetic mutations.
Zhou L, Zhang Y, Chen S, Kmieciak M, Leng Y, Lin H, Rizzo KA, Dumur CI, Ferreira-Gonzalez A, Dai Y, Grant S. Zhou L, et al. Leukemia. 2015 Apr;29(4):807-18. doi: 10.1038/leu.2014.296. Epub 2014 Oct 6. Leukemia. 2015. PMID: 25283841 Free PMC article. - Expanding roles of cell cycle checkpoint inhibitors in radiation oncology.
Hauge S, Eek Mariampillai A, Rødland GE, Bay LTE, Landsverk HB, Syljuåsen RG. Hauge S, et al. Int J Radiat Biol. 2023;99(6):941-950. doi: 10.1080/09553002.2021.1913529. Epub 2021 Apr 20. Int J Radiat Biol. 2023. PMID: 33877959 Review. - DNA damage checkpoint kinases in cancer.
Smith HL, Southgate H, Tweddle DA, Curtin NJ. Smith HL, et al. Expert Rev Mol Med. 2020 Jun 8;22:e2. doi: 10.1017/erm.2020.3. Expert Rev Mol Med. 2020. PMID: 32508294 Review.
Cited by
- Wee1 inhibition potentiates Wip1-dependent p53-negative tumor cell death during chemotherapy.
Clausse V, Goloudina AR, Uyanik B, Kochetkova EY, Richaud S, Fedorova OA, Hammann A, Bardou M, Barlev NA, Garrido C, Demidov ON. Clausse V, et al. Cell Death Dis. 2016 Apr 14;7(4):e2195. doi: 10.1038/cddis.2016.96. Cell Death Dis. 2016. PMID: 27077811 Free PMC article. - Identification of a new target of miR-16, Vacuolar Protein Sorting 4a.
Adhikari N, Guan W, Capaldo B, Mackey AJ, Carlson M, Ramakrishnan S, Walek D, Gupta M, Mitchell A, Eckman P, John R, Ashley E, Barton PJ, Hall JL. Adhikari N, et al. PLoS One. 2014 Jul 17;9(7):e101509. doi: 10.1371/journal.pone.0101509. eCollection 2014. PLoS One. 2014. PMID: 25033200 Free PMC article. - MicroRNA 26a (miR-26a)/KLF4 and CREB-C/EBPβ regulate innate immune signaling, the polarization of macrophages and the trafficking of Mycobacterium tuberculosis to lysosomes during infection.
Sahu SK, Kumar M, Chakraborty S, Banerjee SK, Kumar R, Gupta P, Jana K, Gupta UD, Ghosh Z, Kundu M, Basu J. Sahu SK, et al. PLoS Pathog. 2017 May 30;13(5):e1006410. doi: 10.1371/journal.ppat.1006410. eCollection 2017 May. PLoS Pathog. 2017. PMID: 28558034 Free PMC article. - Neuroblastoma: oncogenic mechanisms and therapeutic exploitation of necroptosis.
Nicolai S, Pieraccioli M, Peschiaroli A, Melino G, Raschellà G. Nicolai S, et al. Cell Death Dis. 2015 Dec 3;6(12):e2010. doi: 10.1038/cddis.2015.354. Cell Death Dis. 2015. PMID: 26633716 Free PMC article. Review. - The role of microRNA-26a in human cancer progression and clinical application.
Chen J, Zhang K, Xu Y, Gao Y, Li C, Wang R, Chen L. Chen J, et al. Tumour Biol. 2016 Jun;37(6):7095-108. doi: 10.1007/s13277-016-5017-y. Epub 2016 Apr 2. Tumour Biol. 2016. PMID: 27039398 Review.
References
- Bourdon JC, De Laurenzi V, Melino G, Lane D. p53: 25 years of research and more questions to answer. Cell Death Differ. 2003;10:397–399. - PubMed
- Brown JP, Wei WY, Sedivy JM. Bypass of senescence after disruption of p21(CIP1/WAF1) gene in normal diploid human fibroblasts. Science. 1997;277:831–834. - PubMed
- Deng C, Zhang P, Harper JW, Elledge SJ, Leder P. Mice lacking p21CIP1/WAF1 undergo normal development, but are defective in G1 checkpoint control. Cell. 1995;82:675–684. - PubMed
- Waldman T, Kinzler KW, Vogelstein B. P21 is necessary for the P53-mediated G(1) arrest in human cancer-cells. Cancer Res. 1995;55:5187–5190. - PubMed
Publication types
MeSH terms
Substances
LinkOut - more resources
Full Text Sources
Other Literature Sources
Research Materials
Miscellaneous


