GATA1s induces hyperproliferation of eosinophil precursors in Down syndrome transient leukemia - PubMed (original) (raw)
. 2014 Jun;28(6):1259-70.
doi: 10.1038/leu.2013.373. Epub 2013 Dec 13.
L Stachorski 1, S Emmrich 1, K Reinhardt 1, J Xu 2, Z Shao 2, S Käbler 1, T Dertmann 1, J Hitzler 3, I Roberts 4, P Vyas 5, G Juban 5, C Hennig 6, G Hansen 6, Z Li 7, S Orkin 2, D Reinhardt 1, J-H Klusmann 1
Affiliations
- PMID: 24336126
- PMCID: PMC4047213
- DOI: 10.1038/leu.2013.373
GATA1s induces hyperproliferation of eosinophil precursors in Down syndrome transient leukemia
A Maroz et al. Leukemia. 2014 Jun.
Abstract
Transient leukemia (TL) is evident in 5-10% of all neonates with Down syndrome (DS) and associated with N-terminal truncating GATA1 mutations (GATA1s). Here we report that TL-cell clones generate abundant eosinophils in a substantial fraction of patients. Sorted eosinophils from patients with TL and eosinophilia carried the same GATA1s mutations as sorted TL blasts, consistent with their clonal origin. TL blasts exhibited a genetic program characteristic of eosinophils and differentiated along the eosinophil lineage in vitro. Similarly, ectopic expression of Gata1s, but not Gata1, in wild-type CD34(+)-hematopoietic stem and progenitor cells induced hyperproliferation of eosinophil promyelocytes in vitro. Although GATA1s retained the function of GATA1 to induce eosinophil genes by occupying their promoter regions, GATA1s was impaired in its ability to repress oncogenic MYC and the pro-proliferative E2F transcription network. Chromatin Immunoprecipitation Sequencing (ChIP-seq) indicated reduced GATA1s occupancy at the MYC promoter. Knockdown of MYC, or the obligate E2F-cooperation partner DP1, rescued the GATA1s-induced hyperproliferative phenotype. In agreement, terminal eosinophil maturation was blocked in Gata1(Δe2) knockin mice, exclusively expressing Gata1s, leading to accumulation of eosinophil precursors in blood and bone marrow. These data suggest a direct relationship between the N-terminal truncating mutations of GATA1 and clonal eosinophilia in DS patients.
Conflict of interest statement
Conflict of interest
C.H. has filed patents regarding chip cytometry. The other authors declare no competing financial interests.
Figures
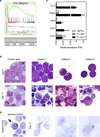
Figure 1. Abnormal eosinophils in a fraction of TL patients
(a) Diagram showing the absolute eosinophil count (AEC; normal: less than 600 ×106/L) and relative eosinophil count (REC; normal: less than 4%) in n=70 DS neonates with TL as assessed by morphological examination of blood smears. (b) TL eosinophils (arrowhead) and a TL-blast (arrow) with eosinophilic granulation (MGG-staining; 1000× original magnification). (c) Microscopic images (left panel; MGG-staining; 1000× original magnification) and sequencing (right panel) of sorted CD15+/CD16+ TL-eosinophils and CD34+/CD41+/low blasts (n=4). The mutated regions are highlighted in red (duplication, insertion and point mutations) and blue (deletion). Patient #1 and #2 are male (GATA1 hemizygous), while #3 and #4 are female (GATA1 heterozygous). All photomicrographs were taken using an Olympus BX41 Microscope.
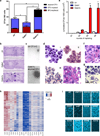
Figure 2. TL-blasts express an eosinophil program and can differentiate into eosinophils
(a) GSEA of eosinophil genes (39) in sorted TL-blasts (n=6) compared to non-DS AMKL (n=5). (b) Microscopic images (MGG-staining, 1000× original magnification) of CD34+ cells (left) and TL-blasts (right; n=3) of DS patients on day 0 and on day 11 of culture in myeloid (SCF/ IL3/ G-CSF/ GM-CSF) differentiation medium. (c) Expression of eosinophil and basophil genes in undifferentiated (day 0) and differentiated TL-blasts (day 11) as well as HSPCs measured by qRT-PCR (n=3; mean±SD). B2M expression was used as an endogenous control. (d) Microscopic images (toluidine blue staining, 1000× original magnification) of TL-blasts of one representative patient on day 11 of culture in myeloid differentiation medium. Normal blood basophils were used as a positive staining control (left). Photomicrographs were taken with a Keyence Biorevo BZ-9000 microscope and processed with the BZ-II viewer software.
Figure 3. Overexpression of GATA1s perturbs normal myeloid differentiation of human fetal CD34+-HSPCs
(a) Schematic illustration of the LeGO-iG-shSC (ctr), LeGO-iG-Gata1/shG1 (Gata1) and LeGO-iG-Gata1s/shG1 (Gata1s) vectors (30). (b) qRT-PCR of mouse Gata1 and human GATA1 using specific primers in LeGO-iG-shSC (ctr)-, LeGO-iG-Gata1/shG1 (Gata1/shG1)- and LeGO-iG-Gata1s/shG1 (Gata1s/shG1)-transduced fetal CD34+-HSPCs (mean±SD of replicates; *PANOVA<0.05 compared to ctr). (c) FACS analysis of _Gata1_-, _Gata1s_- and empty vector control (ctr)-transduced HSPCs grown for 14 days in myeloid differentiation medium. Representative dot plots of n=4 independent experiments are presented. (d) MGG staining of empty vector, _Gata1_- and _Gata1s_-transduced cells on day 14 of myeloid differentiation culture (1000× original magnification). Photomicrographs were taken with a Keyence Biorevo BZ-9000 microscope and processed with the BZ-II viewer software. (e) Number of _Gata1_-, _Gata1s_- and empty vector control (ctr)-transduced fetal HSPCs grown in myeloid differentiation medium relative to the control. Data from n=4 independent experiments are presented as mean±SD. **PANOVA<0.01 compared to ctr.
Figure 4. Gata1s induces the proliferation of eosinophil precursors
(a) Number of CFUs per 500 _Gata1_-, _Gata1s_- and empty vector control (ctr)-transduced fetal CD34+-HSPCs. Replicates from n=4 independent experiments are presented as mean±SD. (*PANOVA<0.05 of the total CFU count compared to ctr). (b) Photograph (1× original magnification) of collagen-based colony-forming assays of _Gata1_-, _Gata1s_- and empty vector control (ctr)-transduced fetal CD34+-HSPCs. (c) Microscopic images (phase contrast, 50× original magnification) of a control CFU-G (top) and atypical Gata1s-CFUs (bottom). (d) Microscopic images of cells from an individual picked atypical Gata1s-CFU (1000× original magnification). (i) MGG-staining; (ii) esterase staining (EST); (iii) myeloperoxidase staining (MPO); (iv) periodic acid-Shiff staining (PAS). (e) Replating capacity of Gata1s-CFUs calculated as the cumulative CFU count per each round of replating compared to the _Gata1_- and empty vector-transduced HSPCs (***PANOVA<0.001 compared to ctr). (f) Morphology (MGG-staining; 1000× original magnification) of _Gata1s_-transduced HSPCs after the third round of replating. (g) Toluidine blue staining of _Gata1s_-transduced cells from a picked CFU (1000× original magnification). Peripheral blood basophils (bottom) were used as a positive control. (h–i) Expression of surface and intracellular markers of _Gata1s_-transduced cells from an individual picked Gata1s-CFU measured by chip cytometry. A clustered heatmap of transformed fluorescence intensity data (h) and raw image data (j) are presented. Photomicrographs were taken with an Olympus BX41 Microscope and processed with AnalySIS software (Olympus Corporation).
Figure 5. Expression of lineage markers and genes in Gata1-/ Gata1s-transduced HSPCs
(a) Heatmap of the normalized enrichment score (NES) obtained by GSEA of _Gata1_-, _Gata1s_- and empty vector control (ctr)-transduced fetal HSPCs grown 4 days (and 14 days) in myeloid differentiation medium compared to empty vector control (ctr)-transduced cells on day 0 (n=2). Gene sets specific (more than 2-fold, PANOVA<0.05) for human monocytes, granulocytes, megakaryocytes, erythroid cells and CD34+-HSPCs (Emmrich and Klusmann, unpublished data), and specific for eosinophils and mast cells (39) were used. The corresponding enrichment plots and statistics are presented in Supplementary Figures 8–11. (b) The expression of key erythroid, monocytic, eosinophil and basophil genes was validated by qRT-PCR in replicates from another independent experiment (mean±SD of replicates; *PANOVA<0.05, **PANOVA<0.01, ***PANOVA<0.001 compared to ctr). (c) ChIP-seq density plots of Gata1 (blue) and Gata1s (red) enrichment on promoter regions of eosinophil genes EPX and CLC.
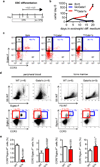
Figure 6. Gata1s perturbs eosinophilopoiesis in mice
(a) Schematic illustration of the eosinophil ESC differentiation protocol. (b) Number of bio_Gata1_-, bio_Gata1s_- and BirA control murine ESCs grown in eosinophil differentiation medium relative to day 0. Data from n=3 independent experiments are presented as mean±SD. (c) FACS analysis on day 20 of eosinophil ESC differentiation. Mean±SD of n=3 independent experiments is indicated. (d–e) FACS analysis for eosinophils in peripheral blood and bone marrow of WT and Gata1Δe2-mice (14). (d) FACS-plots and mean±SEM. (e) Diagrams and statistics for the indicated populations in the peripheral blood (left) and bone marrow (right).
Figure 7. Gata1s fails to repress E2F target genes in eosinophilic precursors
(a) GSEAs of E2F target genes previously identified by ChIP-chip analysis (48) in _Gata1_-, _Gata1s_- and empty vector control (ctr)-transduced fetal HSPCs grown for 4 days in the myeloid differentiation medium: Gata1s vs. ctr (left), Gata1s vs. Gata1 (middle) and Gata1 vs. ctr (right). Enrichment plots (top) and statistics (table below) are provided. (b) qRT-PCR of key E2F target genes in _Gata1_-, _Gata1s_- and empty vector control (ctr)-transduced fetal HSPCs grown for 7 days in the myeloid differentiation medium from another independent experiment (mean±SD of replicates; *PANOVA<0.05, **PANOVA<0.01, ***PANOVA<0.001 compared to ctr). (c) ChIP-seq density plots of Gata1 and Gata1s on MYC genomic region and (d) ChIP followed by qRT-PCR (mean±SD of replicates; *PANOVA<0.05, **PANOVA<0.01, ***PANOVA<0.001 compared to ctr). The PCR amplicon is shown as green bar in Figure 7c. (e) Luciferase reporter assay using the MYC promoter in GATA1/GATA1s transfected CMK cells. pGL4.1 was used as a negative control (mean relative luminescence unit±SD of n=2 independent experiments; *PANOVA<0.05, **PANOVA<0.01, ***PANOVA<0.001 compared to empty vector ctr).
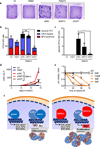
Figure 8. Knockdown of either MYC or DP1 partially rescues GATA1s-induced hyperproliferative phenotype of eosinophil precursor cells
(a) Photograph (1× original magnification) of collagen-based colony-forming assays of an empty vector control (ctr), _Gata1_-, _Gata1s_-, shMYC/Gata1s and _shDP1/Gata1s_-transduced fetal CD34+-HSPCs. Number of CFUs (b) and atypical eosinophilic CFUs (c) per 500 empty vector (ctr), _Gata1_-, _Gata1s_-, shMYC/Gata1s and _shDP1/Gata1s_-transduced fetal CD34+-HSPCs. Replicates from n=2 independent experiments are presented as mean±SD (*PANOVA<0.05 of the total CFU count compared to ctr). (d) Number of empty vector control (ctr), _Gata1_-, _Gata1s_-, shMYC/Gata1s and shDP1/Gata1s -transduced fetal CD34+-HSPCs grown in myeloid differentiation medium relative to day 0. Data from n=2 independent experiments are presented as mean±SD. ****PANOVA<0.0001 compared to Gata1s. (e) Number of _Gata1s_-eosinophil precursors (after 20 days of culture) treated with MYC inhibitor JQ1 (52) relative to the untreated control. Data from n=2 independent experiments are presented as mean±SD. ****PANOVA<0.0001. (f) Model of GATA1s-mediated proliferation of eosinophil progenitors. Both GATA1 and GATA1s bind promoters of eosinophil genes therefore activate eosinophil differentiation program. GATA1 represses E2F transcription network and transcription of MYC, therefore works as “molecular brake” to restrict proliferation of eosinophil progenitor cells. GATA1s fails to repress E2F transcription network and MYC and thus causes hyperproliferation of eosinophil progenitors in DS-TL patients.
Similar articles
- A unique role of GATA1s in Down syndrome acute megakaryocytic leukemia biology and therapy.
Xavier AC, Edwards H, Dombkowski AA, Balci TB, Berman JN, Dellaire G, Xie C, Buck SA, Matherly LH, Ge Y, Taub JW. Xavier AC, et al. PLoS One. 2011;6(11):e27486. doi: 10.1371/journal.pone.0027486. Epub 2011 Nov 16. PLoS One. 2011. PMID: 22110660 Free PMC article. - Blasts in transient leukaemia in neonates with Down syndrome differentiate into basophil/mast-cell and megakaryocyte lineages in vitro in association with down-regulation of truncated form of GATA1.
Miyauchi J, Ito Y, Tsukamoto K, Takahashi H, Ishikura K, Sugita K, Miyashita T. Miyauchi J, et al. Br J Haematol. 2010 Mar;148(6):898-909. doi: 10.1111/j.1365-2141.2009.08038.x. Epub 2010 Jan 11. Br J Haematol. 2010. PMID: 20064153 - Modeling Down Syndrome Myeloid Leukemia by Sequential Introduction of GATA1 and STAG2 Mutations in Induced Pluripotent Stem Cells with Trisomy 21.
Barwe SP, Sebastian A, Sidhu I, Kolb EA, Gopalakrishnapillai A. Barwe SP, et al. Cells. 2022 Feb 11;11(4):628. doi: 10.3390/cells11040628. Cells. 2022. PMID: 35203280 Free PMC article. - GATA1 and cooperating mutations in myeloid leukaemia of Down syndrome.
Garnett C, Cruz Hernandez D, Vyas P. Garnett C, et al. IUBMB Life. 2020 Jan;72(1):119-130. doi: 10.1002/iub.2197. Epub 2019 Nov 26. IUBMB Life. 2020. PMID: 31769932 Review. - Transient leukemia (transient myeloproliferative disorder, transient abnormal myelopoiesis) of Down syndrome.
Brink DS. Brink DS. Adv Anat Pathol. 2006 Sep;13(5):256-62. doi: 10.1097/01.pap.0000213039.93328.44. Adv Anat Pathol. 2006. PMID: 16998319 Review.
Cited by
- Mechanism of KIT gene regulation by GATA1 lacking the N-terminal domain in Down syndrome-related myeloid disorders.
Kanezaki R, Toki T, Terui K, Sato T, Kobayashi A, Kudo K, Kamio T, Sasaki S, Kawaguchi K, Watanabe K, Ito E. Kanezaki R, et al. Sci Rep. 2022 Nov 29;12(1):20587. doi: 10.1038/s41598-022-25046-z. Sci Rep. 2022. PMID: 36447001 Free PMC article. - Leukemogenesis in infants and young children with trisomy 21.
Roberts I. Roberts I. Hematology Am Soc Hematol Educ Program. 2022 Dec 9;2022(1):1-8. doi: 10.1182/hematology.2022000395. Hematology Am Soc Hematol Educ Program. 2022. PMID: 36485097 Free PMC article. - RNA-Binding Proteins in Acute Leukemias.
Schuschel K, Helwig M, Hüttelmaier S, Heckl D, Klusmann JH, Hoell JI. Schuschel K, et al. Int J Mol Sci. 2020 May 12;21(10):3409. doi: 10.3390/ijms21103409. Int J Mol Sci. 2020. PMID: 32408494 Free PMC article. Review. - miR-99a/100~125b tricistrons regulate hematopoietic stem and progenitor cell homeostasis by shifting the balance between TGFβ and Wnt signaling.
Emmrich S, Rasche M, Schöning J, Reimer C, Keihani S, Maroz A, Xie Y, Li Z, Schambach A, Reinhardt D, Klusmann JH. Emmrich S, et al. Genes Dev. 2014 Apr 15;28(8):858-74. doi: 10.1101/gad.233791.113. Genes Dev. 2014. PMID: 24736844 Free PMC article. - Modeling Transient Abnormal Myelopoiesis Using Induced Pluripotent Stem Cells and CRISPR/Cas9 Technology.
Barwe SP, Sidhu I, Kolb EA, Gopalakrishnapillai A. Barwe SP, et al. Mol Ther Methods Clin Dev. 2020 Sep 16;19:201-209. doi: 10.1016/j.omtm.2020.09.007. eCollection 2020 Dec 11. Mol Ther Methods Clin Dev. 2020. PMID: 33102613 Free PMC article.
References
- Hasle H, Clemmensen IH, Mikkelsen M. Risks of leukaemia and solid tumours in individuals with Down's syndrome. Lancet. 2000;355(9199):165–169. - PubMed
- Hasle H, Abrahamsson J, Arola M, Karow A, O'Marcaigh A, Reinhardt D, et al. Myeloid leukemia in children 4 years or older with Down syndrome often lacks GATA1 mutation and cytogenetics and risk of relapse are more akin to sporadic AML. Leukemia. 2008;22(7):1428–1430. - PubMed
- Lightfoot J, Hitzler JK, Zipursky A, Albert M, Macgregor PF. Distinct gene signatures of transient and acute megakaryoblastic leukemia in Down syndrome. Leukemia. 2004;18(10):1617–1623. - PubMed
- Blink M, Buitenkamp TD, van den Heuvel-Eibrink MM, Danen-van Oorschot AA, de HV, Reinhardt D, et al. Frequency and prognostic implications of JAK 1-3 aberrations in Down syndrome acute lymphoblastic and myeloid leukemia. Leukemia. 2011;25(8):1365–1368. - PubMed
Publication types
MeSH terms
Substances
Grants and funding
- MC_UU_12009/14/MRC_/Medical Research Council/United Kingdom
- R01 HL032259/HL/NHLBI NIH HHS/United States
- R01 HL107663/HL/NHLBI NIH HHS/United States
- K01 DK093543/DK/NIDDK NIH HHS/United States
- MC_UU_12009/11/MRC_/Medical Research Council/United Kingdom
LinkOut - more resources
Full Text Sources
Other Literature Sources
Medical


