Biotin ligase tagging identifies proteins proximal to E-cadherin, including lipoma preferred partner, a regulator of epithelial cell-cell and cell-substrate adhesion - PubMed (original) (raw)
. 2014 Feb 15;127(Pt 4):885-95.
doi: 10.1242/jcs.140475. Epub 2013 Dec 11.
Affiliations
- PMID: 24338363
- PMCID: PMC3924204
- DOI: 10.1242/jcs.140475
Biotin ligase tagging identifies proteins proximal to E-cadherin, including lipoma preferred partner, a regulator of epithelial cell-cell and cell-substrate adhesion
Christina M Van Itallie et al. J Cell Sci. 2014.
Abstract
Known proteins associated with the cell-adhesion protein E-cadherin include catenins and proteins involved in signaling, trafficking and actin organization. However, the list of identified adherens junction proteins is likely to be incomplete, limiting investigation into this essential cell structure. To expand the inventory of potentially relevant proteins, we expressed E-cadherin fused to biotin ligase in MDCK epithelial cells, and identified by mass spectrometry neighboring proteins that were biotinylated. The most abundant of the 303 proteins identified were catenins and nearly 40 others that had been previously reported to influence cadherin function. Many others could be rationalized as novel candidates for regulating the adherens junction, cytoskeleton, trafficking or signaling. We further characterized lipoma preferred partner (LPP), which is present at both cell contacts and focal adhesions. Knockdown of LPP demonstrated its requirement for E-cadherin-dependent adhesion and suggested that it plays a role in coordination of the cell-cell and cell-substrate cytoskeletal interactions. The analysis of LPP function demonstrates proof of principle that the proteomic analysis of E-cadherin proximal proteins expands the inventory of components and tools for understanding the function of E-cadherin.
Keywords: Adherens junction; Biotin ligase; E-cadherin; Proteomics.
Figures
Fig. 1.
The E-cadherin–biotin-ligase fusion protein and biotinylated proteins colocalize with endogenous E-cadherin. (A) Myc-tagged EcadBL (Myc, middle) colocalized with endogenous E-cadherin (left and right, merge) detected using a canine-specific E-cadherin antibody that does not recognize the human EcadBL fusion protein. (B) In the presence (bottom panels) but not the absence (top panels) of exogenous biotin, fluorescent streptavidin signal (middle and right panels) colocalizes with the EcadBL fusion protein (Myc, left and right panels). Scale bars: 20 µm.
Fig. 2.
Proteomic analysis of proteins proximal to EcadBL. (A) Coomassie-Blue-stained SDS-PAGE of biotinylated proteins from EcadBL-expressing MDCK cells exposed to biotin overnight eluted from streptavidin beads; an aliquot of this sample and two other independent isolates were used for proteomic analysis. (B) Graph of relative abundance of proteins identified by mass spectrometry. The _y_-axis is calculated as follows: PSMs from each of the three isolations were normalized (PSM for each proteins/total PSMs for that isolation), these normalized PSMs were averaged between the three runs and then divided by the number of theoretical peptides falling in the size range detectable by MS (Pisitkun et al., 2012) and this value multiplied by 1000. Proteins were ordered by this value (largest to smallest); points on the _x_-axis indicate individual unique proteins identified using the Canis familiaris Ref Seq database (688 total). The top five most abundant proteins (all catenins) are listed. (C) Functional analysis of the 250 most abundant proteins identified as proximal to EcadBL. Cytoskel, cytoskeletal proteins; Ubiq, ubiquitin-related proteins.
Fig. 3.
Immunofluorescent localization of LPP to cell contacts and focal adhesions. Top panels are confocal microscopic sections of the apical region of MDCK cells, which reveal that LPP (middle panel, red) is concentrated at cell contacts (white arrowhead) with E-cadherin (left panel, green and merge, right panel, yellow). Bottom panels are basal sections of the same cells, showing that LPP (middle panel, red) but not E-cadherin (left panel, green) is also localized to focal adhesions (white arrow). Scale bar: 20 µm.
Fig. 4.
Proximity ligation assay demonstrates proximity of E-cadherin and LPP at adherens junctions. MDCK cells plated on coverslips were incubated with E-cadherin (rabbit) and podocalyxin (mouse) antibodies (top left), E-cadherin (rabbit) and catenin delta-1 (mouse) antibodies (top right), E-cadherin (rabbit) and LPP (mouse) antibodies (bottom left) and LPP (mouse) antibody alone (bottom right). Cells were then incubated with anti-mouse minus and anti-rabbit plus PLA reagents followed by ligation and far-red amplification reagents; nuclei were stained with Hoechst 33342 reagent during the last three washes. Fluorescent signal corresponding to successful amplification is only evident in the positive control, E-cadherin with catenin delta-1 antibodies (top right) and in the cells incubated with E-cadherin and LPP antibodies (bottom left).
Fig. 5.
Immunoblot analysis of control and LPP-knockdown cells. (A) MDCK and two independent knockdown cell lines were probed for expression of (left, top panel), LPP (red) and γ-tubulin (green), (left, second panel), ZO-1 (red) and ZO-2 (green), (left, third panel), VASP (green) and actin (red), (left, bottom panel), p120 catenin (red), (right, top panel), zyxin (green) and γ-tubulin (red), (right, second panel), e-cadherin (red) and β-catenin (green), (right, third panel), myosin 2B (green), (right, fourth panel), myosin 2A (green) and (right, bottom panel) α-actinin (red). (B) Quantification of replicate immunoblots reveals increased levels of zyxin in the LPP-knockdown cells (300% of control values) and decreased levels of LPP (less than 5% of control values), myosin 2B (30% of control values) and slightly decreased levels of E-cadherin (70%) of control levels. The levels of most other proteins were unaltered in the LPP knockdowns. Values are means ± s.d.
Fig. 6.
LPP-knockdown cells show diminished E-cadherin-dependent adhesion. (A) MDCK control and two separate LPP-knockdown cell lines were cultured on glass coverslips for 3 days and either extracted (right panels) or not (left panels) with CSK buffer before fixation and immunofluorescence staining for E-cadherin. Scale bar: 20 µm. (B) Representative line scan analysis of images as shown in C demonstrates little loss of E-cadherin fluorescence in control cells after CSK extraction (top panels). By contrast, there is greater loss of signal from E-cadherin fluorescence in LPP-knockdown cells after CSK extraction (right two bottom panels) compared with unextracted cells (left two bottom panels). (C) Schematic of modified assay to measure E-cadherin-dependent adhesion. MDCK and LPP-knockdown cells were separately labeled with fluorescent dyes, mixed and incubated for 60 minutes on E-cadherin- or fibronectin-coated plates. Wells were washed to remove loosely adhering cells and the relative fluorescent signals from MDCK and LPP-knockdown cells were compared with unwashed wells. (D) MDCK control cells adhered twice as well as LPP-knockdown cells to E-cadherin-coated wells; there was no difference in adhesion to fibronectin in the control versus knockdown cells. Values are means ± s.d.; *P<0.005 by unpaired Student's _t_-test.
Fig. 7.
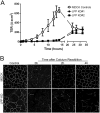
LPP knockdown slows barrier recovery after calcium removal. Confluent MDCK and LPP cell monolayers were exposed to calcium-free media for 18 hours. At t = 0 hours, calcium-free medium was replaced with normal calcium-containing media and (A) TER was measured on duplicate filters at the indicated intervals. Unlike MDCK cell controls, LPP-knockdown cells failed to recover appreciable TER over the first 15 hours after cells were placed back into normal calcium-containing medium. By 24 hours, TER values in the knockdown cells were similar to control MDCK cells. (B) Filters with MDCK controls and LPP-knockdown cells from the above time points were collected, and recovery of ZO-1 at tight junctions monitored by immunofluorescence. By 4 hours, ZO-1 staining has become continuous in control cells but not in LPP-knockdown cells. Scale bars: 20 µm.
Fig. 8.
Actin in subconfluent LPP-knockdown cells is less well organized than in MDCK control cells. Confocal immunofluorescent localization of F-actin with Rhodamine-phalloidin in freshly plated (4 hours) MDCK (top panels) reveals a narrow cortical band of actin in isolated cells. By contrast (bottom panels), actin in LPP-knockdown cells is loosely organized in actin cables that are found both near cell borders and elsewhere in the cells. Scale bars: 20 µm.
Fig. 9.
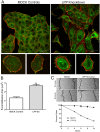
LPP-knockdown cells have larger, less numerous focal adhesions and decreased migration in wound-healing assays. (A) MDCK control cells (left panels) and LPP-knockdown cells (right panels) were stained for paxillin (green) and actin (red). Both in cell islands and in isolated cells, there were larger and fewer focal adhesions than in MDCK control cells and cortical actin appeared slightly less organized in knockdown cells. (B) Focal adhesion size as defined by paxillin staining was measured in control MDCK and LPP-knockdown cells using ImageJ, n = 133 and 219 focal adhesions, respectively for control and knockdown cells. Values are means ± s.d.; P<0.001, unpaired Student's _t_-test. (C) Confluent monolayers of MDCK and LPP-knockdown cells were wounded using a plastic pipette tip and (top panel) wound edges photographed at indicated intervals up to 10 hours post wounding. Distances between wound edges at predetermined places were measured using ImageJ (bottom panel); at least three measurements were made at each time point. Similar results were seen with three LPP-knockdown cell lines. Scale bar: 50 µm.
Similar articles
- The N and C termini of ZO-1 are surrounded by distinct proteins and functional protein networks.
Van Itallie CM, Aponte A, Tietgens AJ, Gucek M, Fredriksson K, Anderson JM. Van Itallie CM, et al. J Biol Chem. 2013 May 10;288(19):13775-88. doi: 10.1074/jbc.M113.466193. Epub 2013 Apr 3. J Biol Chem. 2013. PMID: 23553632 Free PMC article. - Actin protrusions push at apical junctions to maintain E-cadherin adhesion.
Li JXH, Tang VW, Brieher WM. Li JXH, et al. Proc Natl Acad Sci U S A. 2020 Jan 7;117(1):432-438. doi: 10.1073/pnas.1908654117. Epub 2019 Dec 23. Proc Natl Acad Sci U S A. 2020. PMID: 31871203 Free PMC article. - Mechanosensitive Adaptation of E-Cadherin Turnover across adherens Junctions.
de Beco S, Perney JB, Coscoy S, Amblard F. de Beco S, et al. PLoS One. 2015 Jun 5;10(6):e0128281. doi: 10.1371/journal.pone.0128281. eCollection 2015. PLoS One. 2015. PMID: 26046627 Free PMC article. - Dynamic Regulation of Vascular Permeability by Vascular Endothelial Cadherin-Mediated Endothelial Cell-Cell Junctions.
Rho SS, Ando K, Fukuhara S. Rho SS, et al. J Nippon Med Sch. 2017;84(4):148-159. doi: 10.1272/jnms.84.148. J Nippon Med Sch. 2017. PMID: 28978894 Review. - Integration of Cadherin Adhesion and Cytoskeleton at Adherens Junctions.
Mège RM, Ishiyama N. Mège RM, et al. Cold Spring Harb Perspect Biol. 2017 May 1;9(5):a028738. doi: 10.1101/cshperspect.a028738. Cold Spring Harb Perspect Biol. 2017. PMID: 28096263 Free PMC article. Review.
Cited by
- RhoGAP19D inhibits Cdc42 laterally to control epithelial cell shape and prevent invasion.
Fic W, Bastock R, Raimondi F, Los E, Inoue Y, Gallop JL, Russell RB, St Johnston D. Fic W, et al. J Cell Biol. 2021 Apr 5;220(4):e202009116. doi: 10.1083/jcb.202009116. J Cell Biol. 2021. PMID: 33646271 Free PMC article. - Assembly of the β4-Integrin Interactome Based on Proximal Biotinylation in the Presence and Absence of Heterodimerization.
Myllymäki SM, Kämäräinen UR, Liu X, Cruz SP, Miettinen S, Vuorela M, Varjosalo M, Manninen A. Myllymäki SM, et al. Mol Cell Proteomics. 2019 Feb;18(2):277-293. doi: 10.1074/mcp.RA118.001095. Epub 2018 Nov 7. Mol Cell Proteomics. 2019. PMID: 30404858 Free PMC article. - Comparative interactomics analysis reveals potential regulators of α6β4 distribution in keratinocytes.
Te Molder L, Hoekman L, Kreft M, Bleijerveld O, Sonnenberg A. Te Molder L, et al. Biol Open. 2020 Aug 13;9(8):bio054155. doi: 10.1242/bio.054155. Biol Open. 2020. PMID: 32709696 Free PMC article. - Sensing Actin Dynamics through Adherens Junctions.
Indra I, Troyanovsky RB, Shapiro L, Honig B, Troyanovsky SM. Indra I, et al. Cell Rep. 2020 Feb 25;30(8):2820-2833.e3. doi: 10.1016/j.celrep.2020.01.106. Cell Rep. 2020. PMID: 32101754 Free PMC article. - Formin-mediated actin polymerization at cell-cell junctions stabilizes E-cadherin and maintains monolayer integrity during wound repair.
Rao MV, Zaidel-Bar R. Rao MV, et al. Mol Biol Cell. 2016 Sep 15;27(18):2844-56. doi: 10.1091/mbc.E16-06-0429. Epub 2016 Jul 20. Mol Biol Cell. 2016. PMID: 27440924 Free PMC article.
References
Publication types
MeSH terms
Substances
LinkOut - more resources
Full Text Sources
Other Literature Sources
Research Materials
Miscellaneous


