Endosomal WASH and exocyst complexes control exocytosis of MT1-MMP at invadopodia - PubMed (original) (raw)
. 2013 Dec 23;203(6):1063-79.
doi: 10.1083/jcb.201306162.
Carine Rossé, Antonio Castro-Castro, Marie Irondelle, Emilie Lagoutte, Perrine Paul-Gilloteaux, Claire Desnos, Etienne Formstecher, François Darchen, David Perrais, Alexis Gautreau, Maud Hertzog, Philippe Chavrier
- PMID: 24344185
- PMCID: PMC3871436
- DOI: 10.1083/jcb.201306162
Endosomal WASH and exocyst complexes control exocytosis of MT1-MMP at invadopodia
Pedro Monteiro et al. J Cell Biol. 2013.
Abstract
Remodeling of the extracellular matrix by carcinoma cells during metastatic dissemination requires formation of actin-based protrusions of the plasma membrane called invadopodia, where the trans-membrane type 1 matrix metalloproteinase (MT1-MMP) accumulates. Here, we describe an interaction between the exocyst complex and the endosomal Arp2/3 activator Wiskott-Aldrich syndrome protein and Scar homolog (WASH) on MT1-MMP–containing late endosomes in invasive breast carcinoma cells. We found that WASH and exocyst are required for matrix degradation by an exocytic mechanism that involves tubular connections between MT1-MMP–positive late endosomes and the plasma membrane in contact with the matrix. This ensures focal delivery of MT1-MMP and supports pericellular matrix degradation and tumor cell invasion into different pathologically relevant matrix environments. Our data suggest a general mechanism used by tumor cells to breach the basement membrane and for invasive migration through fibrous collagen-enriched tissues surrounding the tumor.
Figures
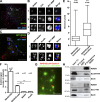
Figure 1.
WASH and exocyst complex associate on adjacent subdomains on MT1-MMP–positive endosomes. (A) Association of endogenous WASH and cortactin (Cttn) on microdomains on MT1-MMPmCh–positive late endosomes. (B) Zoom of boxed regions in A. Images represent the middle plane of the cells. (C) MDA-MB-231 cells transfected with GFP-WASH were plated on cross-linked gelatin, stained for Exo84 and MT1-MMP, and imaged by 3D deconvolution microscopy. (D) Zoom of boxed region in C (box 1) and from another cell (box 2). Bars: (A and C) 5 µm; (B and D) 1 µm. (E) Box plots of the distance between adjacent puncta of WASH and cortactin or Exo84 on MT1-MMP–positive endosomes (in pixels). Whiskers show 25–75%. Numbers of cells (n) and of WASH-cortactin and WASH-Exo84 doublets (d) analyzed from independent experiments are indicated. (F) Quantification of Duolink dots using different antibody pairs as indicated (mean Duolink dots per cell ± SEM; n represents the number of cells analyzed for each condition). ***, P < 0.001 as compared with WASH-Exo84 combination. (G) Immunolabeling of MT1-MMP (green) was performed after the Duolink reaction between WASH and Exo84 antibodies (red dots). Bar, 5 µm. (H) Coimmunoprecipitation of exocyst subunits with WASH in HeLa cell lysates. Bound proteins were analyzed by immunoblotting with antibodies against WASH, HA-tag, and Sec8. Input lysates (1%) were loaded as control.
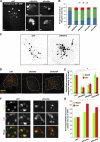
Figure 2.
Regulation of MT1-MMP–positive endosome dynamics by WASH and exocyst complex. (A and B) MDA-MB-231 cells treated with the indicated siRNAs were plated on cross-linked gelatin and stained for endogenous MT1-MMP. Bars, 5 µm. Cells were scored according to the distribution of MT1-MMP–positive endosomes, i.e., normal distribution (#1, blue boxes in B), clustered endosomes (#2, green box), and aggregated endosomes (#3, red box). Values ploted in B are mean ± SEM of normalized endosome distribution from three independent experiments scoring ∼100 cells for each siRNA. *, P < 0.05; **, P < 0.01; ***, P < 0.001 compared with siNT-treated cells (B). (C) MDA-MB-231 cells expressing MT1-MMP-mCh were treated as in A and time series were acquired by spinning-disk microscopy (see
Video 2
). Still images from the time series are shown. Arrows point to tubular extensions emanating from MT1-MMP–positive endosomes in cells depleted of WASH. Bars, 5 µm. (D) MDA-MB-231 cells treated with the indicated siRNA were processed for immunofluorescence microscopy with antibodies against cortactin (red) and WASH (green). Images were acquired by 3D deconvolution microscopy of the middle plane of the cells. A region of interest (dashed line) was drawn manually around WASH-cortactin structures for quantification (shown in E). Bars, 5 µm. (E) Quantification of the integrated intensity of perinuclear endosomal cortactin and WASH in cells treated as in D and normalized to the integrated intensity in control cells in two independent experiments. ns, not significant; *, P < 0.05; **, P < 0.01 compared with control. (F) MDA-MB-231 cells treated with the indicated siRNAs were processed for immunofluorescence microscopy with cortactin and WASH antibodies and analyzed by high-resolution (∼100-nm spatial resolution) 3D SIM. Bar, 1 µm. (G) Quantification of the projected surface of WASH and cortactin puncta in cells as described in F, normalized to mean projected surface of the puncta in control cells set to 100 (three independent experiments; n = 25 puncta for each condition; *, P < 0.05; ***, P < 0.001 compared with control).
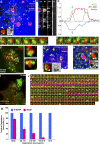
Figure 3.
Association of WASH endosomal puncta with invadopodia. (A) MDA-MB-231 cells plated on cross-linked FITC-labeled gelatin (blue) were stained with antibodies against MT1-MMP (red) and WASH (green) and imaged by 3D deconvolution microscopy. Image is a single section in the ventral plane of the cell in contact with gelatin. Insets corresponding to the boxed region show split channels with dashed line representing the contour of the MT1-MMP–containing endosome projected on the FITC-gelatin image. Arrowhead points to matrix degradation restricted to WASH puncta adjacent to MT1-MMP–positive endosome. Bars: (main) 5 µm; (inset) 1 µm. (B) Orthogonal section through the dashed line in A. From left to right: merged image, MT1-MMP (M), WASH (W), and FITC-gelatin (G) signals. (C) Fluorescence intensity profile through the dashed line in the boxed region in A (x-axis, in pixels; y-axis, in arbitrary units). (D and E) MDA-MB-231 cells expressing MT1-MMPmCh and GFP-WASH (D) or GFP-Exo84 (E) plated on cross-linked gelatin and analyzed by live-cell dual color TIRFM. Time interval between each image is 1 s. Bars, 1 µm. (F) BT-549 cells plated on cross-linked gelatin were fixed and immunostained for MT1-MMP and WASH and analyzed by TIRFM. Insets are higher magnification views of the boxed regions. (G and H) Cells treated as in A, stained with antibodies against MT1-MMP (red) and p34-Arc subunit of Arp2/3 complex (G, green) or FAM21 (H, green). Arrowheads point to the accumulation of the markers near degradative invadopodia adjacent to MT1-MMP–positive endosomes. Bars: (main) 5 µm; (inset) 1 µm. (I) MDA-MB-231 cells expressing GFP-cortactin and MT1-MMP-mCh plated on cross-linked gelatin and analyzed by dual color TIRFM. A still image from a representative time-lapse series is shown. (J) A series of time-lapse TIRFM images corresponding to the boxed region in panel I. Numbers in the series of time-lapse images represent the time in minutes. Two events of docking of MT1-MMP–containing endosomes (labeled #1 and #2) are boxed in pink. (K) Cells as in A were stained for cortactin and WASH or N-WASP. The graph shows the percentage of WASH- (pink bars) or N-WASP–positive (blue bars) degradative invadopodia positive for cortactin (not depicted) as a function of the surface of matrix degradation (in pixels). Values are means ± SEM scoring 360 invadopodia from 15 WASH-labeled cells and 135 invadopodia from five N-WASP–labeled cells.
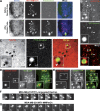
Figure 4.
Tubular connection between MT1-MMP–containing late endosomes and the invadopodial plasma membrane. (A) MDA-MB-231 cells expressing MT1-MMPmCh were plated on cross-linked gelatin. One optical section was taken in the ventral plane of the cells by confocal spinning disk microscopy (top). A second optical section was taken after a 1-min pulse of FITC-dextran added to the medium (bottom). Arrowheads point to MT1-MMP–positive endosomes filled with FITC-dextran during the pulse. The double-headed arrow points to an endosome that lost its MT1-MMP content and filled up with FITC-dextran. Bar, 5 µm. (B) MDA-MB-231 cells expressing DsRed-cortactin treated as in A and imaged immediately after the FITC-dextran pulse. Arrowheads point to cortactin-positive puncta adjacent to dextran-labeled endosomes. Bars, 5 µm. (C) MDA-MB-231 cells expressing MT1-MMPmCh (not depicted) were plated on cross-linked fluorescent gelatin, pulsed with FITC-dextran, and analyzed by confocal spinning disk microscopy 1–2 min after the pulse. Arrowheads point to focal degradation of the matrix adjacent to a FITC-labeled endosome. Dashed line represents the contour of the FITC-dextran–containing endosome projected on the gelatin image. (D and E) MDA-MB-231 cells expressing Rab7-GFP (D) or VAMP7-GFP (E) were plated on cross-linked gelatin for 5 h. An optical section was taken immediately after a 1-min pulse of A647-dextran added to the medium. Insets are higher magnification views of the boxed regions that point to Rab7- (D) or VAMP7 (E)-positive endosomes filled with A647-dextran during the pulse. Bars: (main) 5 µm; (insets) 1 µm). (F) Live-cell imaging of MDA-MB-231 cells analyzed by TIRFM immediately after the FITC-dextran pulse. The indicated times in the image gallery are seconds after the pulse. Arrowhead points to a tubular extension emanating from the FITC-dextran–labeled endosome during regurgitation of the fluid-phase tracer. Bar, 2 µm. (G) MDA-MB-231 cells expressing MT1-MMPmCh analyzed by TIRFM. The arrowhead points to an MT1-MMP–positive tubule. Bar, 1 µm.
Figure 5.
WASH and exocyst complex are required for invadopodial degradation of the matrix. (A) Effect of WASH or Exo84 silencing on the density of MT1-MMPmCh–positive vesicles in the subplasma membrane region of MDA-MB-231 cells observed by TIRFM. Insets are the corresponding wide-field images showing similar MT1-MMP expression. Bars, 5 µm. (B) Box plots showing the density of subplasma membrane MT1-MMP vesicles. Number of cells analyzed from four experiments is indicated (n). *, P < 0.05; ***, P < 0.001 (compared with control cells treated with siNT). (C) MDA-MB-231 cells expressing MT1-MMPpHluorin and DsRed-cortactin were plated on cross-linked gelatin for 2–3 h and analyzed by dual color TIRFM. A merged image from a representative time-lapse series is shown. (D, top) Split signals from the boxed region in C showing accumulations of MT1-MMPpHluorin at cortactin-positive invadopodia. Bar, 5 µm. (bottom) Kymograph views of TIRF time series acquired every 10 s. (E) MDA-MB-231 cells expressing MT1-MMPpHluorin were treated with the indicated siRNAs, plated on cross-linked gelatin, and analyzed by TIRFM. Plots show the percentage of cells with MT1-MMPpHluorin–positive invadopodia. Values are means ± SEM from three independent experiments scoring a total of 150–200 cells for each cell population. ***, P < 0.001 (compared with cells treated with non-targeting siRNA).
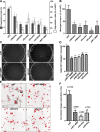
Figure 6.
WASH and exocyst complex are required for matrix remodeling and the invasive potential of breast tumor cells. (A) MDA-MB-231 cells treated with indicated siRNAs were plated on cross-linked FITC-labeled gelatin and the percentage of degradative cells (gray bars) and the degradation index (white bars) were calculated. Values are means ± SEM from at least three independent experiments scoring a total of 300–400 cells for each siRNA. *, P < 0.05; **, P < 0.01; ***, P < 0.001 (compared with siNT-treated cells). (B) MDA-MB-231 cells treated with indicated siRNAs were quantified on the lower side of the Transwell filter after invasion through Matrigel. Values are mean ± SEM of normalized percentage from two to three independent experiments. *, P < 0.05; **, P < 0.01 (compared with siNT-treated cells). (C) 3D type I collagen circular invasion assay of MDA-MB-231 cells expressing Histone-2B-GFP treated with indicated siRNAs after 48 h. Dashed circles represent the collagen–cell interface at time 0. (D) Values represent mean invasion index ± SEM for the different cell populations from three independent experiments, normalized to cells treated with non-targeting siRNA (***, P < 0.001). (E) MDA-MB-231 cells treated with the indicated siRNAs were embedded in collagen I. Pericellular collagenolysis was detected using anti-Col1-3/4C antibodies (in black in the inverted image). Nuclei were stained with DAPI (red). Bars, 50 µm. (F) Quantification of collagenolysis by MDA-MB-231 cells treated with the indicated siRNAs. Values are mean normalized degradation index ± SEM from three (siNT, siExo84d, and siMT1-MMP) or two independent experiments (siWASHd). n represents the number of cells analyzed for each cell population. ***, P < 0.001 (as compared with siNT-treated cells).
Figure 7.
WASH- and cortactin-positive MT1-MMP–containing endosomes are recruited in the periphery of linear invadopodia in association with collagen fibers. (A) MDA-MB-231 cells on a layer of collagen I fibers stained with anti-Col1-3/4C antibodies recognizing MMP-cleaved collagen I (red) and for F-actin (green) revealing collagenolytic linear invadopodia. Inset is a higher magnification of the boxed region. Bars, 5 µm. (B and C) Cells were plated on a layer of Alexa Fluor 647–conjugated type I collagen (blue) for 30 min and stained for N-WASP (green) and F-actin (red; B) or WASH (green) and cortactin (red; C). Insets are higher magnification of boxed regions. Bars: (main and B [inset]) 5 µm; (C, inset) 1 µm. (D) MDA-MB-231 cells expressing GFP-WASH (green) and DsRed-cortactin (red) were plated on a layer of Alexa Fluor 647–conjugated type I collagen (blue) for 30 min and imaged by confocal spinning disk microscopy. A still image from a representative time-lapse series is shown (t = 25 min). Arrowheads point to WASH- and cortactin-positive puncta (associated with late endosomes) apposed to a cortactin-positive linear invadopodium aligned on collagen fibers. Insets show a higher magnification of WASH and cortactin endosomal puncta. The corresponding time-lapse series is shown in
Video 4
. Bars: (main) 5 µm; (inset) 1 µm. (E) Higher magnification of the boxed region in D at representative time points. A linear cortactin-positive invadopodium aligned with collagen fibers forms on the inner face of the plasma membrane (13–14 min; red arrowheads); at 60 min, this structure disassembled while collagen I fibers were remodeled. Time is in minutes. Bar, 5 µm. (F–H) Cells on Alexa Fluor 647–conjugated type I collagen (blue) stained for MT1-MMP (red) and cortactin (green). G and H are higher magnification of the boxed region in F. Arrows point to cortactin-positive puncta associated with MT1-MMP–containing endosomes in the vicinity of cortactin- and MT1-MMP–positive linear invadopodia (arrowheads). Bars, 5 µm.
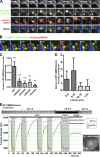
Figure 8.
A WASH- and Exo84-dependent exocytic mechanism of MT1-MMP involved in pericellular collagenolysis. (A and B) Live-cell imaging of MDA-MB-231 cells expressing MT1-MMPpHluorin (green) and mCherry-WASH (red) constructs, plated on a layer of collagen I for 30 min (see
Video 6
). The galleries show exocytosis of MT1-MMPpHluorin–positive endosomes (green arrowheads) in the vicinity of a collagen type I fiber (blue). These endosomes harbor WASH-positive patches (red arrowheads). The asterisks in B point the reacidification of a WASH- and MT1-MMPpHluorin–positive endosome. Time is represented in minutes. Bars, 2 µm. (C) MDA-MB-231 cells expressing MT1-MMPmCherry and MT1-MMPpHluorin silenced for the indicated proteins were seeded on a layer of type I collagen fibers and imaged over a 30-min time perios and the frequency of MT1-MMPpHLuorin exocytic events was quantified (box plots of events/cell/min). The number of cells analyzed for each cell population is indicated. *, P < 0.05; **, P < 0.01; ***, P < 0.001 (compared with siNT-treated cells). (D) Lifetime of MT1-MMPpHluorin–positive flashes (in minutes). Data show the number of pHLuorin exocytic flashes per cell for the different lifetimes ± SEM from five cells out of three independent experiments. (E) MDA-MB-231 cells expressing MT1-MMPpHluorin were cultured on a layer of Cy3-labeled type I collagen fibers and subjected to external pH shifts alternating between 7.4 (white zones) and 5.5 (gray zones). The plots represent pHLuorin intensity of a MT1-MMP–positive endosome that underwent exocytosis (circled with a solid line in the inset on the right) and of a region of the plasma membrane (dashed line). The corresponding time-lapse series is shown in
Video 7
. The gallery above the plot represents a sequence starting with external pH 7.4 corresponding to the circled MT1-MMPpHLuorin–positive endosome (see inset). Bars: (inset) 5 µm; (gallery) 1 µm.
Figure 9.
Schematic model of the general mechanism of exocytosis of MT1-MMP–positive late endosomes at the invadopodial plasma membrane. WASH-dependent Arp2/3 complex activation and actin/cortactin assembly controls the dynamics of tubular endosomal membrane extensions (inset i) and tubular endosome-to-plasma connections required for transfer and delivery of MT1-MMP from the endosome to the invadopodial plasma membrane (inset ii). The exocyst complex mediates tethering of MT1-MMP–positive late endosomes with the target membrane (ii). Fusion between the endosomal membrane tubule and the invadopodial plasma membrane may necessitate the SNARE protein VAMP7 (not depicted; Steffen et al., 2008; Williams and Coppolino, 2011). Actin and cortactin assembly at invadopodia requires N-WASP and allows membrane protrusion formation and retention of MT1-MMP (insets ii and iii; Yamaguchi et al., 2005; Artym et al., 2006; Oser et al., 2010; Yu et al., 2012). Mature invadopodia are responsible for penetrating and breaching the basement membrane in contact with carcinoma cells (1 and 2; Hotary et al., 2006; Rowe and Weiss, 2008). In the fibrous, collagen-rich extracellular membrane environment surrounding the tumor (3), fibers that oppose cell movement, involving recognition by yet unidentified collagen receptors, trigger the assembly of N-WASP– and F-actin–positive linear invadopodia and the recruitment and exocytosis of MT1-MMP–containing endosomes based on the conserved WASH and exocyst-dependent mechanism (inset iv).
Similar articles
- Protrudin-mediated ER-endosome contact sites promote MT1-MMP exocytosis and cell invasion.
Pedersen NM, Wenzel EM, Wang L, Antoine S, Chavrier P, Stenmark H, Raiborg C. Pedersen NM, et al. J Cell Biol. 2020 Aug 3;219(8):e202003063. doi: 10.1083/jcb.202003063. J Cell Biol. 2020. PMID: 32479595 Free PMC article. - ARF6-JIP3/4 regulate endosomal tubules for MT1-MMP exocytosis in cancer invasion.
Marchesin V, Castro-Castro A, Lodillinsky C, Castagnino A, Cyrta J, Bonsang-Kitzis H, Fuhrmann L, Irondelle M, Infante E, Montagnac G, Reyal F, Vincent-Salomon A, Chavrier P. Marchesin V, et al. J Cell Biol. 2015 Oct 26;211(2):339-58. doi: 10.1083/jcb.201506002. J Cell Biol. 2015. PMID: 26504170 Free PMC article. - Control of MT1-MMP transport by atypical PKC during breast-cancer progression.
Rossé C, Lodillinsky C, Fuhrmann L, Nourieh M, Monteiro P, Irondelle M, Lagoutte E, Vacher S, Waharte F, Paul-Gilloteaux P, Romao M, Sengmanivong L, Linch M, van Lint J, Raposo G, Vincent-Salomon A, Bièche I, Parker PJ, Chavrier P. Rossé C, et al. Proc Natl Acad Sci U S A. 2014 May 6;111(18):E1872-9. doi: 10.1073/pnas.1400749111. Epub 2014 Apr 21. Proc Natl Acad Sci U S A. 2014. PMID: 24753582 Free PMC article. - Matrix invasion by tumour cells: a focus on MT1-MMP trafficking to invadopodia.
Poincloux R, Lizárraga F, Chavrier P. Poincloux R, et al. J Cell Sci. 2009 Sep 1;122(Pt 17):3015-24. doi: 10.1242/jcs.034561. J Cell Sci. 2009. PMID: 19692588 Review. - Cellular and Molecular Mechanisms of MT1-MMP-Dependent Cancer Cell Invasion.
Castro-Castro A, Marchesin V, Monteiro P, Lodillinsky C, Rossé C, Chavrier P. Castro-Castro A, et al. Annu Rev Cell Dev Biol. 2016 Oct 6;32:555-576. doi: 10.1146/annurev-cellbio-111315-125227. Epub 2016 Aug 8. Annu Rev Cell Dev Biol. 2016. PMID: 27501444 Review.
Cited by
- ARHGAP17 regulates the spatiotemporal activity of Cdc42 at invadopodia.
Kreider-Letterman G, Castillo A, Mahlandt EK, Goedhart J, Rabino A, Goicoechea S, Garcia-Mata R. Kreider-Letterman G, et al. J Cell Biol. 2023 Feb 6;222(2):e202207020. doi: 10.1083/jcb.202207020. Epub 2022 Dec 26. J Cell Biol. 2023. PMID: 36571786 Free PMC article. - Rab31-dependent regulation of transforming growth factor ß expression in breast cancer cells.
Soelch S, Beaufort N, Loessner D, Kotzsch M, Reuning U, Luther T, Kirchner T, Magdolen V. Soelch S, et al. Mol Med. 2021 Dec 14;27(1):158. doi: 10.1186/s10020-021-00419-8. Mol Med. 2021. PMID: 34906074 Free PMC article. - Cellular functions of WASP family proteins at a glance.
Alekhina O, Burstein E, Billadeau DD. Alekhina O, et al. J Cell Sci. 2017 Jul 15;130(14):2235-2241. doi: 10.1242/jcs.199570. Epub 2017 Jun 23. J Cell Sci. 2017. PMID: 28646090 Free PMC article. Review. - Proteolytic and mechanical remodeling of the extracellular matrix by invadopodia in cancer.
Perrin L, Gligorijevic B. Perrin L, et al. Phys Biol. 2022 Nov 21;20(1):10.1088/1478-3975/aca0d8. doi: 10.1088/1478-3975/aca0d8. Phys Biol. 2022. PMID: 36343366 Free PMC article. Review. - ARF6 promotes the formation of Rac1 and WAVE-dependent ventral F-actin rosettes in breast cancer cells in response to epidermal growth factor.
Marchesin V, Montagnac G, Chavrier P. Marchesin V, et al. PLoS One. 2015 Mar 23;10(3):e0121747. doi: 10.1371/journal.pone.0121747. eCollection 2015. PLoS One. 2015. PMID: 25799492 Free PMC article.
References
- Artym V.V., Zhang Y., Seillier-Moiseiwitsch F., Yamada K.M., Mueller S.C. 2006. Dynamic interactions of cortactin and membrane type 1 matrix metalloproteinase at invadopodia: defining the stages of invadopodia formation and function. Cancer Res. 66:3034–3043 10.1158/0008-5472.CAN-05-2177 - DOI - PubMed
- Bartel P.L., Chien C.T., Sternglanz R., Fields S. 1993. Using the two-hybrid system to detect protein-protein interactions. Cellular Interactions in Development: A Practical Approach., Hartley D.A., editor Oxford University Press, Oxford: 153–179
- Carnell M., Zech T., Calaminus S.D., Ura S., Hagedorn M., Johnston S.A., May R.C., Soldati T., Machesky L.M., Insall R.H. 2011. Actin polymerization driven by WASH causes V-ATPase retrieval and vesicle neutralization before exocytosis. J. Cell Biol. 193:831–839 10.1083/jcb.201009119 - DOI - PMC - PubMed
Publication types
MeSH terms
Substances
LinkOut - more resources
Full Text Sources
Other Literature Sources
Molecular Biology Databases
