The evolution of cellular deficiency in GATA2 mutation - PubMed (original) (raw)
Comparative Study
. 2014 Feb 6;123(6):863-74.
doi: 10.1182/blood-2013-07-517151. Epub 2013 Dec 17.
Paul Milne, Laura Jardine, Sasan Zandi, Sabina I Swierczek, Naomi McGovern, Sharon Cookson, Zaveyna Ferozepurwalla, Alexander Langridge, Sarah Pagan, Andrew Gennery, Tarja Heiskanen-Kosma, Sari Hämäläinen, Mikko Seppänen, Matthew Helbert, Eleni Tholouli, Eleonora Gambineri, Sigrún Reykdal, Magnús Gottfreðsson, James E Thaventhiran, Emma Morris, Gideon Hirschfield, Alex G Richter, Stephen Jolles, Chris M Bacon, Sophie Hambleton, Muzlifah Haniffa, Yenan Bryceson, Carl Allen, Josef T Prchal, John E Dick, Venetia Bigley, Matthew Collin
Affiliations
- PMID: 24345756
- PMCID: PMC3916878
- DOI: 10.1182/blood-2013-07-517151
Comparative Study
The evolution of cellular deficiency in GATA2 mutation
Rachel E Dickinson et al. Blood. 2014.
Abstract
Constitutive heterozygous GATA2 mutation is associated with deafness, lymphedema, mononuclear cytopenias, infection, myelodysplasia (MDS), and acute myeloid leukemia. In this study, we describe a cross-sectional analysis of 24 patients and 6 relatives with 14 different frameshift or substitution mutations of GATA2. A pattern of dendritic cell, monocyte, B, and natural killer (NK) lymphoid deficiency (DCML deficiency) with elevated Fms-like tyrosine kinase 3 ligand (Flt3L) was observed in all 20 patients phenotyped, including patients with Emberger syndrome, monocytopenia with Mycobacterium avium complex (MonoMAC), and MDS. Four unaffected relatives had a normal phenotype indicating that cellular deficiency may evolve over time or is incompletely penetrant, while 2 developed subclinical cytopenias or elevated Flt3L. Patients with GATA2 mutation maintained higher hemoglobin, neutrophils, and platelets and were younger than controls with acquired MDS and wild-type GATA2. Frameshift mutations were associated with earlier age of clinical presentation than substitution mutations. Elevated Flt3L, loss of bone marrow progenitors, and clonal myelopoiesis were early signs of disease evolution. Clinical progression was associated with increasingly elevated Flt3L, depletion of transitional B cells, CD56(bright) NK cells, naïve T cells, and accumulation of terminally differentiated NK and CD8(+) memory T cells. These studies provide a framework for clinical and laboratory monitoring of patients with GATA2 mutation and may inform therapeutic decision-making.
Figures
Figure 1
Mononuclear cell profiles of patients with Emberger syndrome, monoMAC, and familial MDS associated with GATA2 mutation. Examples of mononuclear profiling in familial MDS (#18; T354M), monoMAC (#25; del340-381), and Emberger syndrome (#30; A341fs) showing that a DCML-deficiency phenotype may be associated with diverse clinical manifestations and different GATA2 mutations. Populations: (1) CD14+ monocyte; (2) CD16+ monocyte; (3) pDC; (4) CD34+ progenitors; (5) CD141+ mDC; (6) CD1c+ mDC; (7) B cells; and (8) NK cells. Note expansion of CD34+ progenitors.
Figure 2
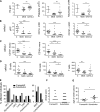
Comparison of _GATA2_-mutated patients with MDS patients and genotype-phenotype correlations. (A-D) Comparison of controls (n = 21), patients with MDS (n = 12), and patients with symptomatic GATA2 mutation (n = 18). (A) Automated blood counts. (B-D) DCs, monocytes, and lymphocyte subsets by Trucount analysis. Analysis was performed as previously described. (E) Summary of clinical features among symptomatic carriers of GATA2 mutation by genotype (11 frameshift and 13 substitutions). (F) Profile of clinical score as defined in Table 1 according to genotype. (G) Age at presentation by genotype. *P < .05; **P < .01; ***P < .001. C, controls (or reference range); HPV, human papilloma virus; mono, monocyte; PAP, pulmonary alveolar proteinosis; URTI, upper respiratory tract infection.
Figure 3
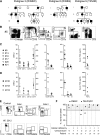
Asymptomatic carriers of GATA2 mutation may develop cellular deficiency, elevated Flt3L, loss of BM progenitors, and clonal myelopoeisis. (A) Three pedigrees identified (mutation indicated) containing asymptomatic relatives (clinical core = 0), carrying GATA2 mutation (open symbols, arrowed). Gray symbols identify 2 patients with either elevated Flt3L (>200 pg/ml) or cytopenia. Filled symbols indicate affected patients with mutation (clinical score = 1 to 4). (B) DC, monocyte, and lymphocyte profiles of patient #5, 1 of 3 healthy carriers of GATA2 mutation showing a normal cellular phenotype at the first point of analysis in 2010. Populations: (1) CD14+ monocyte; (2) CD16+ monocyte; (3) pDC; (4) CD34+ progenitors; (5) CD141+ mDC; (6) CD1c+ mDC; (7) B cell; (8) T cell; and (9) NK cell. (C) Summary of DC and monocyte counts relative to reference ranges for the asymptomatic carriers. Case #5 (filled circle) is shown at first analysis in 2010. Case #21 (filled square) already has cytopenia. (D) Detailed analysis of case #5 showing the loss of cells and rising Flt3L over a 3-year period. (E) BM analysis of case #5 showing loss of B, NK, MLP, and GMP progenitors at midpoint when no cytopenia was evident. CMP, common myeloid progenitor; MEP, megakaryocyte-erythroid progenitor; MPP, multi-potent progenitor. (F) Pattern of X inactivation in females with GATA2 mutation at different stages of clinical evolution. Dominance of >75% is considered evidence of clonal hematopoiesis.
Figure 4
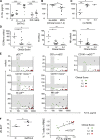
Flt3L is a specific marker of GATA2 mutation. (A) Flt3L was measured by ELISA in the serum of unaffected relatives with WT GATA2 (n = 13), individuals with GATA2 mutation (n = 24), patients with other PID (n = 11), and MDS patients (n = 11). For patients with GATA2 mutation, the clinical score (0 or 1 to 4) is indicated. (B) The relationship between Flt3L and the development of MDS (n = 24). (C) Relationship between Flt3L and clinical score, excluding patients with MDS (n = 18). (D) Decline in DCs/monocytes, B cells, and NK cells with increasing clinical score (n = 24). (E) Relationship between cell counts, Flt3L, and clinical stage (n = 24; shaded regions indicate normal ranges and asterisks indicate P values for Spearman correlation coefficients). (F) Elevation of Flt3L mRNA detected by Q-PCR in GATA2 patients compared with controls, and relationship between serum Flt-3L and percentage of CD3 (ie, T cells in PBMCs). *P < .05; **P < .01; ***P < .001. Q-PCR, quantitative polymerase chain reaction.
Figure 5
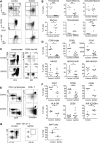
Highly differentiated phenotype of the peripheral lymphoid compartment of patients with GATA2 mutation. (A) Example of B-cell profile of patient with GATA2 mutation compared with control according to published descriptions., Populations: (1) transitional; (2) naïve mature; (3) mature activated; (4) resting memory; (5) plasmablast; and (6) CD38−CD21− (autoimmune-associated). (B) Quantification of _GATA2_-mutated patients vs controls showing depletion of transitional B cells and naïve memory B cells, and accumulation of memory B cells and CD38−CD21− B cells. (C) Example of NK-cell profile of patient with GATA2 mutation compared with control showing the distribution of CD56bright NK cells, and NKG2A+ and KIR+ cells within the CD56dim population. (D) Quantification of _GATA2_-mutated patients vs controls showing CD56bright NK cells and the expression of differentiation-associated antigens within the CD56dim population. Cytomegalovirus seropositivity is indicated by open symbols. (E) Example of CD3+ T-cell profile of a patient with GATA2 mutation compared with control showing CD4:CD8 profile and differentiation according to expression of CCR7 and CD45RA. (F) Quantification of antigen expression by CD8+ T cells of _GATA2_-mutated patients vs controls showing the acquisition of a terminally differentiated phenotype and increased expression of KIR on the CD56+ subset. (G) CD8+ CD161+ Va7.2+ MAIT cells are decreased in patients relative to controls. *P < .05; **P < .01; ***P < .001.
Figure 6
Schematic diagram summarizing the evolution of cellular deficiency in GATA2 mutation. BM MLPs are rapidly lost even in healthy carriers (see Figure 2). Peripheral blood CD34 counts are elevated in many patients (see examples in Figures 1 and 2) and tend to decline with advancing disease (not shown). Flt3L is progressively elevated, but declines as patients develop MDS (see Figure 4). A rapid rise in CD34+ cells and decline in Flt3L may signify the onset of MDS or AML, although AML may occur sporadically without prior cytopenia.
Similar articles
- Loss-of-function germline GATA2 mutations in patients with MDS/AML or MonoMAC syndrome and primary lymphedema reveal a key role for GATA2 in the lymphatic vasculature.
Kazenwadel J, Secker GA, Liu YJ, Rosenfeld JA, Wildin RS, Cuellar-Rodriguez J, Hsu AP, Dyack S, Fernandez CV, Chong CE, Babic M, Bardy PG, Shimamura A, Zhang MY, Walsh T, Holland SM, Hickstein DD, Horwitz MS, Hahn CN, Scott HS, Harvey NL. Kazenwadel J, et al. Blood. 2012 Feb 2;119(5):1283-91. doi: 10.1182/blood-2011-08-374363. Epub 2011 Dec 6. Blood. 2012. PMID: 22147895 Free PMC article. - [GATA2 deficiency].
Nonoyama S. Nonoyama S. Nihon Rinsho. 2014 Oct;72(10):1861-9. Nihon Rinsho. 2014. PMID: 25509816 Review. Japanese. - Altered chemotactic response to CXCL12 in patients carrying GATA2 mutations.
Maciejewski-Duval A, Meuris F, Bignon A, Aknin ML, Balabanian K, Faivre L, Pasquet M, Barlogis V, Fieschi C, Bellanné-Chantelot C, Donadieu J, Schlecht-Louf G, Marin-Esteban V, Bachelerie F. Maciejewski-Duval A, et al. J Leukoc Biol. 2016 Jun;99(6):1065-76. doi: 10.1189/jlb.5MA0815-388R. Epub 2015 Dec 28. J Leukoc Biol. 2016. PMID: 26710799 - GATA2 deficiency: a protean disorder of hematopoiesis, lymphatics, and immunity.
Spinner MA, Sanchez LA, Hsu AP, Shaw PA, Zerbe CS, Calvo KR, Arthur DC, Gu W, Gould CM, Brewer CC, Cowen EW, Freeman AF, Olivier KN, Uzel G, Zelazny AM, Daub JR, Spalding CD, Claypool RJ, Giri NK, Alter BP, Mace EM, Orange JS, Cuellar-Rodriguez J, Hickstein DD, Holland SM. Spinner MA, et al. Blood. 2014 Feb 6;123(6):809-21. doi: 10.1182/blood-2013-07-515528. Epub 2013 Nov 13. Blood. 2014. PMID: 24227816 Free PMC article. - Germline GATA2 Mutation and Bone Marrow Failure.
McReynolds LJ, Calvo KR, Holland SM. McReynolds LJ, et al. Hematol Oncol Clin North Am. 2018 Aug;32(4):713-728. doi: 10.1016/j.hoc.2018.04.004. Epub 2018 May 28. Hematol Oncol Clin North Am. 2018. PMID: 30047422 Free PMC article. Review.
Cited by
- Human papillomavirus disease in GATA2 deficiency: a genetic predisposition to HPV-associated female anogenital malignancy.
Dancy E, Stratton P, Pichard DC, Marciano BE, Cowen EW, McBride AA, Van Doorslaer K, Merideth MA, Salmeri N, Hughes MS, Heller T, Parta M, Hickstein DD, Kong HH, Holland SM, Zerbe CS. Dancy E, et al. Front Immunol. 2024 Aug 29;15:1445711. doi: 10.3389/fimmu.2024.1445711. eCollection 2024. Front Immunol. 2024. PMID: 39267745 Free PMC article. - Pathogenic GATA2 genetic variants utilize an obligate enhancer mechanism to distort a multilineage differentiation program.
Katsumura KR, Liu P, Kim JA, Mehta C, Bresnick EH. Katsumura KR, et al. Proc Natl Acad Sci U S A. 2024 Mar 5;121(10):e2317147121. doi: 10.1073/pnas.2317147121. Epub 2024 Feb 29. Proc Natl Acad Sci U S A. 2024. PMID: 38422019 Free PMC article. - Genetic Characteristics of Patients with Young-Onset Myelodysplastic Neoplasms.
Kim HY, Yoo KH, Jung CW, Kim HJ, Kim SH. Kim HY, et al. J Clin Med. 2023 Dec 13;12(24):7651. doi: 10.3390/jcm12247651. J Clin Med. 2023. PMID: 38137719 Free PMC article. - A Nationwide Study of GATA2 Deficiency in Italy Reveals Novel Symptoms and Genotype-phenotype Association.
Roncareggi S, Girardi K, Fioredda F, Pedace L, Arcuri L, Badolato R, Bonanomi S, Borlenghi E, Cirillo E, Coliva T, Consonni F, Conti F, Farruggia P, Gambineri E, Guerra F, Locatelli F, Mancuso G, Marzollo A, Masetti R, Micalizzi C, Onofrillo D, Piccini M, Pignata C, Raddi MG, Santini V, Vendemini F, Biondi A, Saettini F. Roncareggi S, et al. J Clin Immunol. 2023 Nov;43(8):2192-2207. doi: 10.1007/s10875-023-01583-8. Epub 2023 Oct 14. J Clin Immunol. 2023. PMID: 37837580 - The Molecular and Genetic Mechanisms of Inherited Bone Marrow Failure Syndromes: The Role of Inflammatory Cytokines in Their Pathogenesis.
Kawashima N, Bezzerri V, Corey SJ. Kawashima N, et al. Biomolecules. 2023 Aug 16;13(8):1249. doi: 10.3390/biom13081249. Biomolecules. 2023. PMID: 37627314 Free PMC article. Review.
References
Publication types
MeSH terms
Substances
Grants and funding
- G0800358/MRC_/Medical Research Council/United Kingdom
- P01 CA108671/CA/NCI NIH HHS/United States
- G0701897/MRC_/Medical Research Council/United Kingdom
- MR/L006197/1/MRC_/Medical Research Council/United Kingdom
- Wellcome Trust/United Kingdom
LinkOut - more resources
Full Text Sources
Other Literature Sources
Medical
Research Materials
Miscellaneous


