Influence of post-traumatic stress disorder on neuroinflammation and cell proliferation in a rat model of traumatic brain injury - PubMed (original) (raw)
Influence of post-traumatic stress disorder on neuroinflammation and cell proliferation in a rat model of traumatic brain injury
Sandra A Acosta et al. PLoS One. 2013.
Abstract
Long-term consequences of traumatic brain injury (TBI) are closely associated with the development of severe psychiatric disorders, such as post-traumatic stress disorder (PTSD), yet preclinical studies on pathological changes after combined TBI with PTSD are lacking. In the present in vivo study, we assessed chronic neuroinflammation, neuronal cell loss, cell proliferation and neuronal differentiation in specific brain regions of adult Sprague-Dawley male rats following controlled cortical impact model of moderate TBI with or without exposure to PTSD. Eight weeks post-TBI, stereology-based histological analyses revealed no significant differences between sham and PTSD alone treatment across all brain regions examined, whereas significant exacerbation of OX6-positive activated microglial cells in the striatum, thalamus, and cerebral peduncle, but not cerebellum, in animals that received TBI alone and combined TBI-PTSD compared with PTSD alone and sham treatment. Additional immunohistochemical results revealed a significant loss of CA3 pyramidal neurons in the hippocampus of TBI alone and TBI-PTSD compared to PTSD alone and sham treatment. Further examination of neurogenic niches revealed a significant downregulation of Ki67-positive proliferating cells, but not DCX-positive neuronally migrating cells in the neurogenic subgranular zone and subventricular zone for both TBI alone and TBI-PTSD compared to PTSD alone and sham treatment. Comparisons of levels of neuroinflammation and neurogenesis between TBI alone and TBI+PTSD revealed that PTSD did not exacerbate the neuropathological hallmarks of TBI. These results indicate a progressive deterioration of the TBI brain, which, under the conditions of the present approach, was not intensified by PTSD, at least within our time window and within the examined areas of the brain. Although the PTSD manipulation employed here did not exacerbate the pathological effects of TBI, the observed long-term inflammation and suppressed cell proliferation may evolve into more severe neurodegenerative diseases and psychiatric disorders currently being recognized in traumatized TBI patients.
Conflict of interest statement
Competing Interests: This work was supported by a grant from the Department of Defense and intramural support from the USF Veterans Reintegration Committee and the Neuroscience Collaborative program. The opinions expressed in this publication are those of the authors and not of the Department of Veterans Affairs or the US government. Senior author Dr. Cesar Borlongan is a PLOS ONE Editorial Board member. This does not alter the authors' adherence to all the PLOS ONE policies on sharing data and materials.
Figures
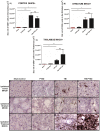
Figure 1. OX6 + expression in ipsilateral gray matter subcortical regions of TBI and TBI-PTSD rats.
Figures 1A–C represent quantitative data of estimated volumes (µm3) of OX6+ in A) cortex, B) striatum, and C) thalamus. Figures 1D–G represent OX6+ immunostaining of the ipsilateral side of cortex in D) sham-no PTSD, E) sham-PTSD, F) TBI-PTSD, G) TBI. Figures H-K represent OX6+ immunostaining of the ipsilateral side of striatum in H) sham-no PTSD, I) sham-PTSD, J) TBI-PTSD, K) TBI. Figures L-O represent OX6+ immunostaining of the ipsilateral side of thalamus in L) sham-no PTSD, M) sham-PTSD, N) TBI-PTSD, O) TBI. Note that in Figure 1C, N, the upregulation of activated microglia cells reach significance only for the group of chronic TBI combined with PTSD. Cortex, F3,20 = 11.90,***p<0.0004; striatum, F3,20 = 6.629, **p<0.0036; thalamus, F3,20 = 5.999, ** p<0.0076. Scale bars for D, E, F, G, H, I, J, K, L, M, N, O are 1 µm.
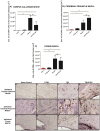
Figure 2. OX6 + expression in ipsilateral subcortical white matter regions of TBI and TBI-PTSD rats.
Figures 2 A–C represent quantitative data of estimated volumes (µm3) of OX6+ in A) corpus callosum, B) cerebral peduncle, and C) fornix. Figures 2D–G represent OX6+ immunostaining of the ipsilateral side of corpus callosum in D) sham-no PTSD, E) sham-PTSD, F) TBI-PTSD, G) TBI. Figures 2 H–K represent OX6+ immunostaining of the ipsilateral side of cerebral peduncle in H) sham-no PTSD, I) sham-PTSD, J) TBI-PTSD, K) TBI. Figures2 L-O represent OX6+ immunostaining of the ipsilateral side of fornix in L) sham-no PTSD, M) sham-PTSD, N) TBI-PTSD, O) TBI. Corpus callosum, F3,20 = 8.611, **p<0.0017, cerebral peduncle F3,20 = 8.550, **p<0.002, fornix, F3,20 = 8.368, **p<0.002. Scale bars for D, E, F, G, H, I, J, K, L, M, N, O are 1 µm.
Figure 3. OX6 + expression in white matter, granular cell layer and molecular layer of the cerebellum of TBI and TBI-PTSD rats.
Figure 3 A represents quantitative data of the estimated volumes (µm3) of OX6+ in three distinct regions of the cerebellum; white matter (WM), granular cell layer (GCL) and molecular layer (ML). Figures 3 B–F represent OX6+ immunostaining of the cerebellum in B) sham-no PTSD, C) sham-PTSD, D) TBI-PTSD, E) TBI. As shown in Figure 3 A, and in the photomicrographs B–E, there is no detectable upregulation of activated microglia cells in any of the examined cerebellar regions or across any of our treatment groups (sham-no PTSD, sham-PTSD, TBI-PTSD, and TBI alone); _p_>0.05. Scale bars for B-E are 1 µm.
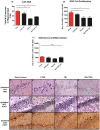
Figure 4. H&E, cell proliferation Ki67+, and neuronal differentiation DCX+ expressions in the hippocampus of TBI and TBI-PTSD rats.
Figures 4 A–C represent quantitative data of A) total # of neurons in hippocampal CA3, B) estimated # of Ki67+ proliferating cells in the SGZ of the DG, and C) the estimated # of DCX+ migrating cells in the SGZ of the DG. Figures 4 D–G represent H&E staining of the ipsilateral hippocampal CA3 region in D) sham-no PTSD, E) sham-PTSD, F) TBI-PTSD, G) TBI. Figures 4 H-K represent Ki67+ immunostaining of the ipsilateral SGZ of the DG in H) sham-no PTSD, I) sham-PTSD, J) TBI-PTSD, K) TBI. Figures 4 L–O represent DCX+ immunostaining of the ipsilateral SGZ of the DG in L) sham-no PTSD, M) sham-PTSD, N) TBI-PTSD, O) TBI. CA3, F3,8 = 13.570, **p<0.0017, SGZ Ki67, F3,20 = 5.017, *p<0.0106, DCX, F3,20 = 1.959 p<0.1512. Scale bars for D–G are 50 µm and H–O are 1 µm.
Figure 5. Cell proliferation Ki67+, and neuronal differentiation DCX+ expression in the SVZ of the lateral ventricle.
Figures 5 A–B represent quantitative data of A) total # of Ki67+ cells representing the number of cell proliferating in the SVZ, B) the estimated # of DCX+ migrating cells in the SVZ of the lateral ventricle. Figures 5 C–F represent Ki67+ immunostaining of the ipsilateral SVZ in C) sham-no PTSD, D) sham-PTSD, E) TBI, F) TBI-PTSD. Figures 5 G–J represent DCX+ immunostaining of the ipsilateral SVZ of the lateral ventricle in G) sham-no PTSD, H) sham-PTSD, I) TBI, J) TBI-PTSD. SVZ Ki67, F3,20 = 7.863, **p<0.0012, SVZ DCX, F3,20 = 0.324, ns p = 0.8076. Scale bars for C–J are 50 µm.
Similar articles
- Long-term upregulation of inflammation and suppression of cell proliferation in the brain of adult rats exposed to traumatic brain injury using the controlled cortical impact model.
Acosta SA, Tajiri N, Shinozuka K, Ishikawa H, Grimmig B, Diamond DM, Sanberg PR, Bickford PC, Kaneko Y, Borlongan CV. Acosta SA, et al. PLoS One. 2013;8(1):e53376. doi: 10.1371/journal.pone.0053376. Epub 2013 Jan 3. PLoS One. 2013. PMID: 23301065 Free PMC article. - Glutathione peroxidase overexpression does not rescue impaired neurogenesis in the injured immature brain.
Potts MB, Rola R, Claus CP, Ferriero DM, Fike JR, Noble-Haeusslein LJ. Potts MB, et al. J Neurosci Res. 2009 Jun;87(8):1848-57. doi: 10.1002/jnr.21996. J Neurosci Res. 2009. PMID: 19170177 Free PMC article. - Maturation-dependent response of neurogenesis after traumatic brain injury in children.
Taylor SR, Smith C, Harris BT, Costine BA, Duhaime AC. Taylor SR, et al. J Neurosurg Pediatr. 2013 Dec;12(6):545-54. doi: 10.3171/2013.8.PEDS13154. Epub 2013 Sep 20. J Neurosurg Pediatr. 2013. PMID: 24053630 - Brain-derived neurotrophic factor in traumatic brain injury, post-traumatic stress disorder, and their comorbid conditions: role in pathogenesis and treatment.
Kaplan GB, Vasterling JJ, Vedak PC. Kaplan GB, et al. Behav Pharmacol. 2010 Sep;21(5-6):427-37. doi: 10.1097/FBP.0b013e32833d8bc9. Behav Pharmacol. 2010. PMID: 20679891 Review. - Pathophysiological Bases of Comorbidity: Traumatic Brain Injury and Post-Traumatic Stress Disorder.
Kaplan GB, Leite-Morris KA, Wang L, Rumbika KK, Heinrichs SC, Zeng X, Wu L, Arena DT, Teng YD. Kaplan GB, et al. J Neurotrauma. 2018 Jan 15;35(2):210-225. doi: 10.1089/neu.2016.4953. Epub 2017 Nov 3. J Neurotrauma. 2018. PMID: 29017388 Review.
Cited by
- Deficits in pattern separation and dentate gyrus proliferation after rodent lateral fluid percussion injury.
Correll EA, Ramser BJ, Knott MV, McCullumsmith RE, McGuire JL, Ngwenya LB. Correll EA, et al. IBRO Neurosci Rep. 2021 Feb 3;10:31-41. doi: 10.1016/j.ibneur.2020.11.005. eCollection 2021 Jun. IBRO Neurosci Rep. 2021. PMID: 33861814 Free PMC article. - Cotinine: A Therapy for Memory Extinction in Post-traumatic Stress Disorder.
Mendoza C, Barreto GE, Iarkov A, Tarasov VV, Aliev G, Echeverria V. Mendoza C, et al. Mol Neurobiol. 2018 Aug;55(8):6700-6711. doi: 10.1007/s12035-018-0869-3. Epub 2018 Jan 15. Mol Neurobiol. 2018. PMID: 29335846 Review. - Loneliness in Posttraumatic Stress Disorder: A Neglected Factor in Accelerated Aging?
Palmer BW, Hussain MA, Lohr JB. Palmer BW, et al. J Ageing Longev. 2022 Dec;2(4):326-339. doi: 10.3390/jal2040027. Epub 2022 Dec 9. J Ageing Longev. 2022. PMID: 36567873 Free PMC article. - Bumetanide Prevents Brain Trauma-Induced Depressive-Like Behavior.
Goubert E, Altvater M, Rovira MN, Khalilov I, Mazzarino M, Sebastiani A, Schaefer MKE, Rivera C, Pellegrino C. Goubert E, et al. Front Mol Neurosci. 2019 Feb 5;12:12. doi: 10.3389/fnmol.2019.00012. eCollection 2019. Front Mol Neurosci. 2019. PMID: 30804751 Free PMC article. - Effects of systemic administration of ibuprofen on stress response in a rat model of post-traumatic stress disorder.
Lee B, Sur B, Yeom M, Shim I, Lee H, Hahm DH. Lee B, et al. Korean J Physiol Pharmacol. 2016 Jul;20(4):357-66. doi: 10.4196/kjpp.2016.20.4.357. Epub 2016 Jun 23. Korean J Physiol Pharmacol. 2016. PMID: 27382352 Free PMC article.
References
- Faul M, Xu L, Wald MM, Coronado VG (2010) Traumatic brain injury in the United States: Emergency department visits, hospitalizations and deaths. Atlanta (GA): Centers for Disease Control and Prevention, National Center for Injury Prevention and Control.
- Sosin DM, Sniezek JE, Waxweiler RJ (1995) Trends in death associated with traumatic brain injury, 1979 through 1992. Success and failure. JAMA 273: 1778–1780. - PubMed
- Coronado VG, Xu L, Basavaraju SV, McGuire LC, Wald MM, et al. (2011) Surveillance for traumatic brain injury-related deaths–United States, 1997–2007. MMWR Surveill Summ 60: 1–32. - PubMed
- Kraus JF (1993) Epidemiology of head injury. In: Cooper PR, editor. Head Injury, 3rd ed. Baltimore: Williams and Wilkins. pp. 1–25.
- Rogers JM, Read CA (2007) Psychiatric comorbidity following traumatic brain injury. Brain Inj 21: 1321–1333. - PubMed
MeSH terms
Substances
Grants and funding
Supported by USF Veterans Reintegration Research Funds and Department of Defense W81XWH-11-1-0634. The funders had no role in study design, data collection and analysis, decision to publish, or preparation of the manuscript.
LinkOut - more resources
Full Text Sources
Other Literature Sources
Medical
Miscellaneous


