Effects of resveratrol on the recovery of muscle mass following disuse in the plantaris muscle of aged rats - PubMed (original) (raw)
Effects of resveratrol on the recovery of muscle mass following disuse in the plantaris muscle of aged rats
Brian T Bennett et al. PLoS One. 2013.
Abstract
Aging is associated with poor skeletal muscle regenerative ability following extended periods of hospitalization and other forms of muscular disuse. Resveratrol (3,5,4'-trihydroxystilbene) is a natural phytoalexin which has been shown in skeletal muscle to improve oxidative stress levels in muscles of aged rats. As muscle disuse and reloading after disuse increases oxidative stress, we hypothesized that resveratrol supplementation would improve muscle regeneration after disuse. A total of thirty-six male Fisher 344 × Brown Norway rats (32 mo.) were treated with either a water vehicle or resveratrol via oral gavage. The animals received hindlimb suspension for 14 days. Thereafter, they were either sacrificed or allowed an additional 14 day period of cage ambulation during reloading. A total of six rats from the vehicle and the resveratrol treated groups were used for the hindlimb suspension and recovery protocols. Furthermore, two groups of 6 vehicle treated animals maintained normal ambulation throughout the experiment, and were used as control animals for the hindlimb suspension and reloading groups. The data show that resveratrol supplementation was unable to attenuate the decreases in plantaris muscle wet weight during hindlimb suspension but it improved muscle mass during reloading after hindlimb suspension. Although resveratrol did not prevent fiber atrophy during the period of disuse, it increased the fiber cross sectional area of type IIA and IIB fibers in response to reloading after hindlimb suspension. There was a modest enhancement of myogenic precursor cell proliferation in resveratrol-treated muscles after reloading, but this failed to reach statistical significance. The resveratrol-associated improvement in type II fiber size and muscle mass recovery after disuse may have been due to decreases in the abundance of pro-apoptotic proteins Bax, cleaved caspase 3 and cleaved caspase 9 in reloaded muscles. Resveratrol appears to have modest therapeutic benefits for improving muscle mass after disuse in aging.
Conflict of interest statement
Competing Interests: Please also note that a co-author on this paper, S.E. Alway is a PLOS ONE Editorial Board member. This does not alter the authors’ adherence to all the PLOS ONE policies on sharing data and materials.
Figures
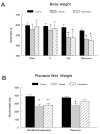
Figure 1. Body and muscle wet weights.
A) Bodyweight measurements of all animals were taken immediately prior to the start of the one-week pretreatment period (Start), prior to suspension (0), following hindlimb suspension (HS), and again following the reloading period recovery in cage control (n=12), vehicle-treated (n=12) or resveratrol-treated (n=12) animals. B. Plantaris muscle wet weights were obtained following HS or R. * P<0.05 vs. cage control.
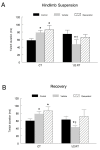
Figure 2. Plantaris muscle twitch characteristics.
Muscle twitch contractile properties including CT and ½ RT were analyzed in the plantaris muscles of both the hindlimb suspension (A) and recovery (B) groups. Each data point represents the average of three measures. * P<0.05 vs. cage control; † P<0.05 vehicle vs. resveratrol.
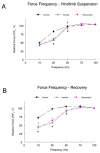
Figure 3. Force-frequency relationship.
A force-frequency curve was plotted for both the hindlimb suspension (A) and recovery (B) groups. Each force-frequency measurement was made three times with a minimum of 5 minutes rest between each contraction, and the average of the three trials was recorded for each animal. * P<0.05 vehicle and resveratrol vs. cage control; † P<0.05 vehicle vs. resveratrol.
Figure 4. Fatigue index.
Plantaris muscle fatigability was expressed as a fatigue index, and calculated as the percent of the initial force ( average of the first three contractions, divided by the force at the end of the fatigue protocol (an average of the force generated in the final three contractions) in a series of 128 consecutive contractions. * P<0.05 vs. cage control; † P<0.05 vehicle vs. resveratrol.
Figure 5. Resveratrol-induced metabolic signaling in the plantaris muscle.
A. Western blots were conducted for plantaris muscles after hindlimb suspension or following recovery from hindlimb suspension. The protein content was measured in total plantaris muscle homogenates via immunoblotting. Total muscle protein lysates were separated on a 4-12% gradient polyacrylamide gel by routine SDS-PAGE. The proteins were electroblotted to nitrocellulose membranes and the signals were developed by chemiluminescence. The proteins included phosphorylated (activated) AMPK, total AMPK, PGC1α, and Sirt1. GAPDH was used as an internal loading control. Con, control; Veh, vehicle-treated; Res, resveratrol treated. B-E. The digital images of the western blots were quantified as optical density x band area using ImageJ software and normalized to GAPDH, which was used as the loading control for each lane. The data include: B, total AMPK; C. phosphorylated AMPK (pAMPK); D. PGC1α; and E. Sirt1. The data are expressed as the protein signal to the GAPDH signal and are reported as mean ± SEM in arbitrary units. A minimum of three western blots were completed for each protein, and the data were averaged for each animal. F. Sirt1 enzyme activity was determined fluorometrically in plantaris muscle homogenates. Data are expressed as arbitrary fluorescent units (AFU)/µg protein. * P<0.05 vs. cage control; †P<0.05 vehicle vs. resveratrol.
Figure 6. Muscle fiber immunocytochemistry.
Frozen tissue cross sections were incubated overnight at 4°C with antibodies directed against the basal lamina (red) and myosin heavy chain I, IIA, or IIB (green). The sections were counterstained with DAPI (blue) to identify the nuclei. Digital images were taken with a confocal microscope. This figure provides a representative example of a section stained for type I myosin heavy chain that was used to measure fiber type composition and CSA analyses for this fiber type in both the hindlimb suspension and recovery groups. Green fibers are positive for type I myosin heavy chains. Scale bars represent 50 µm. * P<0.05 vs. cage control; † P<0.05 vehicle vs. resveratrol.
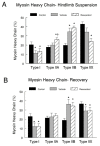
Figure 7. Muscle fiber myosin heavy chain composition and morphology.
Immunocytochemical stained plantaris muscle fibers for myosin heavy chains, from control, vehicle-treated and resveratrol-treated rats were analyzed for their myosin heavy chain fiber composition in both the hindlimb suspension (A) and recovery (B) groups. * P<0.05 vs. cage control.
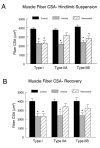
Figure 8. Muscle fiber cross sectional area.
Mean fiber cross sectional area (CSA) measurements were obtained from a minimum of 500 fibers in each muscle for plantaris muscle fibers that expressed type I, IIA, or IIB myosin heavy chains in hindlimb suspension (A) and recovery (B) groups. Four images from non-overlapping regions of each tissue cross-section stained for individual MyHC fibers were used for muscle fiber CSA measures. All images were taken with a Zeiss LSM 510 Meta confocal microscope at a magnification of 20X. Mean fiber CSA of respective fiber types was determined by planimetry. * P<0.05 vs. cage control.
Figure 9. Proliferation of satellite cells.
In order to analyze satellite cell proliferation during the reloading period, a time-released BrdU pellet was inserted into the recovery animals at the point that they were released from suspension. BrdU is a thymidine analogue and it was incorporated into muscle nuclei (satellite cells) that divided. A. A representative section from the plantaris of a resveratrol-treated animal that was reloaded for 14 days following 14 days of hindlimb suspension. The tissue was stained with DAPI to identify all of the nuclei, an anti-BrdU antibody to identify nuclei that had proliferated, and an anti-laminin antibody to identify the basal lamina. The overlay shows the three fluorescent images superimposed. The expanded insert shows examples of BrdU positive nuclei that are co-localized to the DAPI stained myonuclei over the basal lamina (white arrows). Other examples of non-specific (green) staining not on nuclei are evident, but they were not included in the quantification of BrdU positive nuclei. B. BrdU incorporation in muscle nuclei (i.e., proliferated satellite cells) is expressed as the number of BrdU-positive nuclei per one hundred myonuclei. * P<0.05 vs. cage control.
Figure 10. Apoptotic signaling proteins in plantaris muscles.
Plantaris muscle samples were homogenized and total muscle lysates were separated on a 4-12% gradient polyacrylamide gel by routine SDS-PAGE. The proteins were electroblotted to nitrocellulose membranes and the signals were developed by chemiluminescence. A. Representative western blots of apoptotic proteins. Bax, Bcl-xL, Bcl-2, cleaved caspase 3 (CC-3), cleaved caspase 9 (CC-9) and GAPDH. The digital images were quantified as optical density x band area using ImageJ software and normalized to GAPDH, which was used as the loading control for each lane. The data are expressed as the protein signal to the GAPDH signal and are reported as mean ± SEM in arbitrary units. The western blots were run a minimum of three times for each protein, and the data were averaged for each animal’s data point. These data include: Bax (B) Bcl-2 (C), Bcl-xL (D), cleaved caspase 3 (E), and cleaved caspase 9 (F). * P<0.05 vs. cage control; † P<0.05 vehicle vs. resveratrol.
Figure 11. Immunocytochemical evidence for apoptotic nuclei in reloaded muscles.
DNA fragmentation was assessed with TUNEL staining (green) as an indication of nuclei committed to apoptosis in the plantaris muscles from animals. The basal lamina of the muscle fibers was incubated in an anti-lamina antibody (red) to identify nuclei adjacent to or inside the basal lamina of the fibers. Representative tissue cross sections are shown for animals in the hindlimb suspension (A) and recovery (B) groups. C. Quantification of the TUNEL positive nuclei that were located at or below the basal lamina of the muscle fibers in the recovery or cage control animals. *P<0.05 vs. cage control.
Similar articles
- Green tea extract attenuates muscle loss and improves muscle function during disuse, but fails to improve muscle recovery following unloading in aged rats.
Alway SE, Bennett BT, Wilson JC, Sperringer J, Mohamed JS, Edens NK, Pereira SL. Alway SE, et al. J Appl Physiol (1985). 2015 Feb 1;118(3):319-30. doi: 10.1152/japplphysiol.00674.2014. Epub 2014 Nov 20. J Appl Physiol (1985). 2015. PMID: 25414242 Free PMC article. - β-Hydroxy-β-methylbutyrate reduces myonuclear apoptosis during recovery from hind limb suspension-induced muscle fiber atrophy in aged rats.
Hao Y, Jackson JR, Wang Y, Edens N, Pereira SL, Alway SE. Hao Y, et al. Am J Physiol Regul Integr Comp Physiol. 2011 Sep;301(3):R701-15. doi: 10.1152/ajpregu.00840.2010. Epub 2011 Jun 22. Am J Physiol Regul Integr Comp Physiol. 2011. PMID: 21697520 Free PMC article. - β-Hydroxy-β-methylbutyrate (HMB) enhances the proliferation of satellite cells in fast muscles of aged rats during recovery from disuse atrophy.
Alway SE, Pereira SL, Edens NK, Hao Y, Bennett BT. Alway SE, et al. Exp Gerontol. 2013 Sep;48(9):973-84. doi: 10.1016/j.exger.2013.06.005. Epub 2013 Jul 4. Exp Gerontol. 2013. PMID: 23832076 - Costly immunometabolic remodelling in disused muscle buildup through physical exercise.
Padilha CS, Figueiredo C, Deminice R, Krüger K, Seelaender M, Rosa-Neto JC, Lira FS. Padilha CS, et al. Acta Physiol (Oxf). 2022 Mar;234(3):e13782. doi: 10.1111/apha.13782. Epub 2022 Jan 18. Acta Physiol (Oxf). 2022. PMID: 34990078 Review. - Cardiovasomobility: an integrative understanding of how disuse impacts cardiovascular and skeletal muscle health.
Trinity JD, Drummond MJ, Fermoyle CC, McKenzie AI, Supiano MA, Richardson RS. Trinity JD, et al. J Appl Physiol (1985). 2022 Mar 1;132(3):835-861. doi: 10.1152/japplphysiol.00607.2021. Epub 2022 Feb 3. J Appl Physiol (1985). 2022. PMID: 35112929 Free PMC article. Review.
Cited by
- Resveratrol and Vitamin D: Eclectic Molecules Promoting Mitochondrial Health in Sarcopenia.
Russo C, Valle MS, D'Angeli F, Surdo S, Malaguarnera L. Russo C, et al. Int J Mol Sci. 2024 Jul 9;25(14):7503. doi: 10.3390/ijms25147503. Int J Mol Sci. 2024. PMID: 39062745 Free PMC article. Review. - Resveratrol, a Multitasking Molecule That Improves Skeletal Muscle Health.
Toniolo L, Concato M, Giacomello E. Toniolo L, et al. Nutrients. 2023 Jul 31;15(15):3413. doi: 10.3390/nu15153413. Nutrients. 2023. PMID: 37571349 Free PMC article. Review. - Accounting Gut Microbiota as the Mediator of Beneficial Effects of Dietary (Poly)phenols on Skeletal Muscle in Aging.
Ticinesi A, Nouvenne A, Cerundolo N, Parise A, Meschi T. Ticinesi A, et al. Nutrients. 2023 May 18;15(10):2367. doi: 10.3390/nu15102367. Nutrients. 2023. PMID: 37242251 Free PMC article. Review. - Cancer cachexia: molecular mechanisms and treatment strategies.
Setiawan T, Sari IN, Wijaya YT, Julianto NM, Muhammad JA, Lee H, Chae JH, Kwon HY. Setiawan T, et al. J Hematol Oncol. 2023 May 22;16(1):54. doi: 10.1186/s13045-023-01454-0. J Hematol Oncol. 2023. PMID: 37217930 Free PMC article. Review. - The effects of resveratrol and melatonin on cardiac dysfunction in diabetic elderly female rats.
Akgun-Unal N, Ozyildirim S, Unal O, Baltaci SB, Mogulkoc R, Baltaci AK. Akgun-Unal N, et al. Physiol Res. 2023 Apr 30;72(2):187-198. doi: 10.33549/physiolres.935024. Physiol Res. 2023. PMID: 37159853 Free PMC article.
References
Publication types
MeSH terms
Substances
Grants and funding
- P20 RR016440/RR/NCRR NIH HHS/United States
- U54 GM104942/GM/NIGMS NIH HHS/United States
- U54GM104942/GM/NIGMS NIH HHS/United States
- P30 GM103488/GM/NIGMS NIH HHS/United States
- 5P20RR016440-09/RR/NCRR NIH HHS/United States
LinkOut - more resources
Full Text Sources
Other Literature Sources
Research Materials
Miscellaneous
