Dynamic imaging of genomic loci in living human cells by an optimized CRISPR/Cas system - PubMed (original) (raw)
Dynamic imaging of genomic loci in living human cells by an optimized CRISPR/Cas system
Baohui Chen et al. Cell. 2013.
Erratum in
- Cell. 2014 Jan 16;156(1-2):373
Abstract
The spatiotemporal organization and dynamics of chromatin play critical roles in regulating genome function. However, visualizing specific, endogenous genomic loci remains challenging in living cells. Here, we demonstrate such an imaging technique by repurposing the bacterial CRISPR/Cas system. Using an EGFP-tagged endonuclease-deficient Cas9 protein and a structurally optimized small guide (sg) RNA, we show robust imaging of repetitive elements in telomeres and coding genes in living cells. Furthermore, an array of sgRNAs tiling along the target locus enables the visualization of nonrepetitive genomic sequences. Using this method, we have studied telomere dynamics during elongation or disruption, the subnuclear localization of the MUC4 loci, the cohesion of replicated MUC4 loci on sister chromatids, and their dynamic behaviors during mitosis. This CRISPR imaging tool has potential to significantly improve the capacity to study the conformation and dynamics of native chromosomes in living human cells.
Copyright © 2013 Elsevier Inc. All rights reserved.
Figures
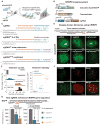
Figure 1. An optimized CRISPR/Cas system for visualizing genomic sequences in living mammalian cells
(A) Overview of CRISPR imaging. Sequence-specific enrichment of fluorescence signals by sgRNA-directed dCas9-EGFP allows the imaging of genomic elements in living cells. (B) The three components of the CRISPR imaging: a doxycycline-inducible dCas9-EGFP fusion protein, a Tet-on 3G transactivator, and target-specific sgRNAs expressed from a murine U6 promoter. (C) Optimized sgRNA designs. sgRNA(F), A-U pair flip; sgRNA(E), a 5-bp extension of the hairpin; sgRNA(F+E), combination of both modifications. Target basepairing region (orange), dCas9 binding hairpin (blue), the _S. pyogenes_-derived terminator (grey), and nucleotide modifications (purple) are shown. (D) CRISPR imaging of human telomeres in RPE cells using different sgRNA designs. The sgRNA target sequence (black line) and the PAM (red line) are shown. sgGAL4 is used as the negative control. (E) Histograms of telomere counts and telomere intensity (measured as % of whole-nucleus GFP) in single cell using sgTelomere and sgTelomere(F+E). The telomere number detected by PNA FISH is also shown. n = 20. (F) Colabeling of telomeres using dCas9-EGFP (green) & PNA FISH (top, red), or dCas9-EGFP & antibody to TRF2 (bottom, red). (G) Optimized sgRNA design improves gene regulation efficiency using dCas9 alone (left) or dCas9-KRAB fusion protein (right). The target sequence (black line) and the PAM (red line) are shown. The data are displayed as mean ± standard deviation for 3 independent experiments. All scale bars: 5 _μ_m. See also Figure S1.
Figure 2. CRISPR imaging of endogenous genes in different human cell lines
(A) Schematic of the human MUC4 gene showing two repeated regions in exon 2 (blue) and intron 3 (yellow). The target sequence (black line) and the PAM (red line) are shown. (B) CRISPR labeling of MUC4 loci (arrows) in RPE cells by targeting the exon 2 repeats or the intron 3 repeats with different sgRNAs. The arrow pairs in the bottom right image indicate replicated MUC4 loci. (C) Histograms of MUC4 loci counts by CRISPR labeling (n = 20). (D) Colocalization of dCas9-EGFP labeling (green) and Oligo DNA FISH labeling (red) for MUC4. (E) CRISPR imaging of MUC4 and telomeres in HeLa cells. sgGAL4 is used as the negative control. (F) CRISPR labeling of the MUC1 loci (arrows) in RPE cells. Schematic of the human MUC1 gene shows the repeat region in exon 3 and intron 3. The target sequence (black line) and the PAM (red line) are shown. All scale bars: 5 _μ_m. See also Figures S2 and S3.
Figure 3. CRISPR imaging of non-repetitive genomic sequences and multiple gene loci
(A) CRISPR labeling of the non-repetitive region of MUC4 intron 1 using multiple optimized sgRNAs. With 26, 36 or 73 sgRNAs, 1 to 3 spots (arrows) can be detected. (B) Histograms of MUC4 loci counts by CRISPR imaging of the non-repetitive MUC4 sequence. (C) Colabeling of the MUC4 exon 2 and intron 3. The physical proximity (~1 kb) of the two target regions does not increase the puncta number as shown in the histograms. (D) Colabeling of MUC1 and MUC4 genes. Labeling two distal genes (MUC1 on chromosome 1 and MUC4 on chromosome 3 respectively) increases the puncta count as shown in the histograms (n = 20). All scale bars: 5 _μ_m. See also Movie S3
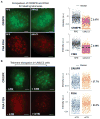
Figure 4. CRISPR imaging detects telomere length
(A) Comparison of telomere length in RPE and UMUC3 cells using CRISPR imaging (upper panels) or PNA FISH (lower panels). The log-scale scatter plot displays the intensity of each identified telomere in RPE (navy) and UMUC3 (purple) cells. (B) hTR-induced telomere elongation in UMUC3 cells visualized by CRISPR (upper panels) or PNA FISH (lower panels). The log-scale scatter plot displays the intensity of each identified telomere without (orange) and with (blue) hTR expression. At least 20 cells were analyzed for each case. All images are maximum z projections. All scale bars: 5 _μ_m. See also Figure S4.
Figure 5. Tracking of telomere dynamics in live cells by CRISPR imaging
(A) CRISPR imaging of telomeres in RPE cells (scale bar: 5 _μ_m) and trajectories of three telomeres with different movement modes (scale bars: 200 nm). The trajectory lengths are 600 frames for 1 & 3 and 260 frames for 2. See Movie S1. (B) Comparison of telomere dynamics using CRISPR (blue) and EGFP-TRF1 (red) labeling in RPE cells. The data are displayed as mean ± standard error. (C) Scatter plot of the CRISPR foci intensity and their microscopic diffusion coefficients. (D) The average MSD curves of telomeres in UMUC3 cells without (blue) and with (orange) hTR. The data are displayed as mean ± standard error. (E) Averaged MSD curves of CRISPR-labeled telomeres in RPE cells measured with scrambled shRNA (blue), TIN2 shRNA (green), or co-expression of TIN2 shRNA and the long (L, red) or short (S, purple) isoform of TIN2. At least 15 cells are analyzed in each case. The data are displayed as mean ± standard error. See also Figure S5 and Movie S1.
Figure 6. Spatial organization and dynamics of the MUC4 gene in RPE cells
(A) Scheme for analyzing the nuclear localization of the MUC4 gene using both sgMUC4-E3 and sgMUC4-I2(F+E). The nucleus is modeled as an oval and then normalized to a round circle to measure MUC4 positions. (B) The histogram of the normalized MUC4 radial position, r. The nuclear envelope is at the unity position. (C) The histogram of the relative angle of MUC4 loci with respect to the center of the nucleus, θ. 50 cells are analyzed for (B) and (C). (D) Single particle tracking of MUC4 loci movement. See Movies S2 and S3. (E) Trajectories of the three loci in (D), which show different confinement sizes, _L_confinement, and microscopic diffusion coefficients, _D_micro (scale bars: 200 nm). The trajectory lengths are 900 frames for 2 & 3 and 115 frames for 1. (F) Paired MUC4 loci after DNA replication. See Movie S4. (G) Histogram of the distance between two MUC4 loci in a pair. 20 cells are analyzed. (H) Long term 3D tracking to measure the pair distances of three MUC4 pairs within a cell. (A), (D), and (F) are 20-frame averages of live recording images. Scale bars: 5 _μ_m. See also Figure S6 and Movies S2 and S4.
Figure 7. Dynamics of the MUC4 loci through mitosis
(A) Snapshots from a MUC4 image sequence in which a HeLa cell undergoes mitosis, showing z maximum projections of 4 _μ_m depth. The arrows indicate the MUC4 loci, which are not completely captured during mitosis because the cell thickness exceeds the z range. See Movie S5. (B) CRISPR labeled HeLa cells fixed and stained with DAPI (blue) to image the relationship between MUC4 loci (green) and the chromosomes. Cells at different stages of mitosis are displayed, showing z maximum projections of 18 _μ_m. Scale bars: 5 _μ_m. See also Movie S5.
Similar articles
- Imaging genomic elements in living cells using CRISPR/Cas9.
Chen B, Huang B. Chen B, et al. Methods Enzymol. 2014;546:337-54. doi: 10.1016/B978-0-12-801185-0.00016-7. Methods Enzymol. 2014. PMID: 25398348 - Live-cell CRISPR imaging in plants reveals dynamic telomere movements.
Dreissig S, Schiml S, Schindele P, Weiss O, Rutten T, Schubert V, Gladilin E, Mette MF, Puchta H, Houben A. Dreissig S, et al. Plant J. 2017 Aug;91(4):565-573. doi: 10.1111/tpj.13601. Epub 2017 Jul 14. Plant J. 2017. PMID: 28509419 Free PMC article. - CASFISH: CRISPR/Cas9-mediated in situ labeling of genomic loci in fixed cells.
Deng W, Shi X, Tjian R, Lionnet T, Singer RH. Deng W, et al. Proc Natl Acad Sci U S A. 2015 Sep 22;112(38):11870-5. doi: 10.1073/pnas.1515692112. Epub 2015 Aug 31. Proc Natl Acad Sci U S A. 2015. PMID: 26324940 Free PMC article. - Progress and Challenges for Live-cell Imaging of Genomic Loci Using CRISPR-based Platforms.
Wu X, Mao S, Ying Y, Krueger CJ, Chen AK. Wu X, et al. Genomics Proteomics Bioinformatics. 2019 Apr;17(2):119-128. doi: 10.1016/j.gpb.2018.10.001. Epub 2019 Jan 30. Genomics Proteomics Bioinformatics. 2019. PMID: 30710789 Free PMC article. Review. - Imaging Specific Genomic DNA in Living Cells.
Chen B, Guan J, Huang B. Chen B, et al. Annu Rev Biophys. 2016 Jul 5;45:1-23. doi: 10.1146/annurev-biophys-062215-010830. Epub 2016 Apr 27. Annu Rev Biophys. 2016. PMID: 27145877 Free PMC article. Review.
Cited by
- ATRX represses alternative lengthening of telomeres.
Napier CE, Huschtscha LI, Harvey A, Bower K, Noble JR, Hendrickson EA, Reddel RR. Napier CE, et al. Oncotarget. 2015 Jun 30;6(18):16543-58. doi: 10.18632/oncotarget.3846. Oncotarget. 2015. PMID: 26001292 Free PMC article. - Reversible RNA acylation for control of CRISPR-Cas9 gene editing.
Habibian M, McKinlay C, Blake TR, Kietrys AM, Waymouth RM, Wender PA, Kool ET. Habibian M, et al. Chem Sci. 2019 Dec 2;11(4):1011-1016. doi: 10.1039/c9sc03639c. Chem Sci. 2019. PMID: 34084356 Free PMC article. - Application of Aptamers Improves CRISPR-Based Live Imaging of Plant Telomeres.
Khosravi S, Schindele P, Gladilin E, Dunemann F, Rutten T, Puchta H, Houben A. Khosravi S, et al. Front Plant Sci. 2020 Aug 20;11:1254. doi: 10.3389/fpls.2020.01254. eCollection 2020. Front Plant Sci. 2020. PMID: 32973827 Free PMC article. - Dysfunctional telomeres trigger cellular senescence mediated by cyclic GMP-AMP synthase.
Abdisalaam S, Bhattacharya S, Mukherjee S, Sinha D, Srinivasan K, Zhu M, Akbay EA, Sadek HA, Shay JW, Asaithamby A. Abdisalaam S, et al. J Biol Chem. 2020 Aug 7;295(32):11144-11160. doi: 10.1074/jbc.RA120.012962. Epub 2020 Jun 15. J Biol Chem. 2020. PMID: 32540968 Free PMC article. - Cas9 Functionally Opens Chromatin.
Barkal AA, Srinivasan S, Hashimoto T, Gifford DK, Sherwood RI. Barkal AA, et al. PLoS One. 2016 Mar 31;11(3):e0152683. doi: 10.1371/journal.pone.0152683. eCollection 2016. PLoS One. 2016. PMID: 27031353 Free PMC article.
References
- Augui S, Nora EP, Heard E. Regulation of X-chromosome inactivation by the X-inactivation centre. Nat Rev Genet. 2011;12:429–442. - PubMed
- Barrangou R, Fremaux C, Deveau H, Richards M, Boyaval P, Moineau S, Romero DA, Horvath P. CRISPR provides acquired resistance against viruses in prokaryotes. Science. 2007;315:1709–1712. - PubMed
- d’Adda di Fagagna F, Reaper PM, Clay-Farrace L, Fiegler H, Carr P, Von Zglinicki T, Saretzki G, Carter NP, Jackson SP. A DNA damage checkpoint response in telomere-initiated senescence. Nature. 2003;426:194–198. - PubMed
Publication types
MeSH terms
Substances
Grants and funding
- OD017887/OD/NIH HHS/United States
- T32 GM007810/GM/NIGMS NIH HHS/United States
- U01 CA168370/CA/NCI NIH HHS/United States
- DA036858/DA/NIDA NIH HHS/United States
- T32 GM007618/GM/NIGMS NIH HHS/United States
- CA168370/CA/NCI NIH HHS/United States
- P50 GM081879/GM/NIGMS NIH HHS/United States
- DP5 OD017887/OD/NIH HHS/United States
- CA096840/CA/NCI NIH HHS/United States
- R01 CA096840/CA/NCI NIH HHS/United States
- GM105913/GM/NIGMS NIH HHS/United States
- GM081879/GM/NIGMS NIH HHS/United States
- GM102706/GM/NIGMS NIH HHS/United States
- P50 GM102706/GM/NIGMS NIH HHS/United States
- R01 DA036858/DA/NIDA NIH HHS/United States
- R00 GM105913/GM/NIGMS NIH HHS/United States
- K99 GM105913/GM/NIGMS NIH HHS/United States
- HHMI/Howard Hughes Medical Institute/United States
LinkOut - more resources
Full Text Sources
Other Literature Sources
Research Materials


