JAK tyrosine kinases promote hierarchical activation of Rho and Rap modules of integrin activation - PubMed (original) (raw)
JAK tyrosine kinases promote hierarchical activation of Rho and Rap modules of integrin activation
Alessio Montresor et al. J Cell Biol. 2013.
Abstract
Lymphocyte recruitment is regulated by signaling modules based on the activity of Rho and Rap small guanosine triphosphatases that control integrin activation by chemokines. We show that Janus kinase (JAK) protein tyrosine kinases control chemokine-induced LFA-1- and VLA-4-mediated adhesion as well as human T lymphocyte homing to secondary lymphoid organs. JAK2 and JAK3 isoforms, but not JAK1, mediate CXCL12-induced LFA-1 triggering to a high affinity state. Signal transduction analysis showed that chemokine-induced activation of the Rho module of LFA-1 affinity triggering is dependent on JAK activity, with VAV1 mediating Rho activation by JAKs in a Gαi-independent manner. Furthermore, activation of Rap1A by chemokines is also dependent on JAK2 and JAK3 activity. Importantly, activation of Rap1A by JAKs is mediated by RhoA and PLD1, thus establishing Rap1A as a downstream effector of the Rho module. Thus, JAK tyrosine kinases control integrin activation and dependent lymphocyte trafficking by bridging chemokine receptors to the concurrent and hierarchical activation of the Rho and Rap modules of integrin activation.
Figures
Figure 1.
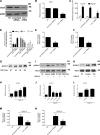
Heterotrimeric Gαi protein signaling is differently involved in Rap1A, RhoA, and Rac1 activation by CXCL12. (A) Static adhesion assay to ICAM-1. Lymphocytes were treated with buffer (not treated [NT]) or 2 µg/ml pertussis toxin (PTx) for 2 h and stimulated with 0.2 µM CXCL12 (agonist); four experiments in triplicate. (B, left) Rap1A activation was measured by pull-down assay. Lymphocytes were treated as in A and stimulated with 0.2 µM CXCL12; representative experiment of three. (right) The relative ratio of the band intensity of GTP-Rap1A was normalized to the level of total Rap1A intensity. (C and D) G-LISA assay detecting RhoA (C) and Rac1 (D) activation. Lymphocytes were treated as in A and stimulated with 0.2 µM CXCL12 (agonist). The percentage of fold increase of the RhoA and Rac1 activation was normalized to the level of NT intensity; mean of three experiments. Error bars show SDs. *, P < 0.01, versus NT.
Figure 2.
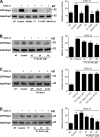
CXCL12 rapidly triggers JAK2 and JAK3 activation independently of heterotrimeric Gαi protein signaling. (A) Time course of JAK2 phosphorylation. Lymphocytes were treated with buffer (NT) or with 0.2 µM CXCL12 for the indicated times. Lysates were immunoprecipitated with antiphosphotyrosine antibody and probed with the anti-JAK2 or anti-JAK3 antibody (C); representative experiment of three. (B) Quantification of immunoreactive bands. The relative ratio of the band intensity of phospho-JAK2 was normalized to the level of NT. Mean values of three experiments. (C) Time course of JAK3 phosphorylation. Lymphocytes were treated as in A; representative experiment of six. (D) Quantification of immunoreactive bands. The relative ratio of the band intensity of phospho-JAK3 was normalized as in B. Mean values of three experiments. (E–H) JAK PTK activation is independent of heterotrimeric Gαi proteins. Lymphocytes were treated with buffer (NT) or 2 µg/ml pertussis toxin (PTx) for 2 h and stimulated with 0.2 µM CXCL12. Lysates were immunoprecipitated as in A. (E and G) Immunoblot of phospho-JAK2 (E) and phospho-JAK3 (G). (F and H) Representative experiment of three for each protein. Quantification of immunoreactive bands. The relative ratio of the band intensity of phospho-JAK2 (F) and phospho-JAK3 (H) was normalized to the level of NT intensity. Mean values of three experiments for each protein. Error bars show SDs. *, P < 0.01, versus NT.
Figure 3.
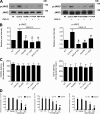
JAK2 and JAK3 control CXCL12-triggered LFA-1–mediated static adhesion to ICAM-1 of human primary T lymphocytes. (A) Effect of JAK inhibitors on JAK2 and JAK3 activation. Lymphocytes were treated with buffer (NT and control), 100 µM AG490, 40 µM P1-TKIP, or 200 µM WHI-P154 for 1 h and stimulated with 0.2 µM CXCL12 for 60 s. Lysates were immunoprecipitated with antiphosphotyrosine antibody and probed with anti-JAK2 (left) or anti-JAK3 antibody (right). The expression level of each protein was assessed in whole-cell lysates with anti-JAK2 or anti-JAK3 antibodies; representative experiment of three. (B) Quantification of immunoreactive bands. The relative ratio of the band intensity of phospho-JAK2 (left) and phospho-JAK3 (right) was normalized to the level of NT intensity. Mean values of three experiments for each protein. *, P < 0.01, versus control. (C) Flow cytometry measurement of CXCR4 (left) and CD18 (right) expression. Lymphocytes were treated as described in A; four experiments. (D) Dose–response effect of JAK inhibition in a static adhesion assay. Lymphocytes were treated with buffer (NT), DMSO (vehicle), AG490 (left), Penetratin-1 (P1) or P1-TKIP (middle), or WHI-P154 (right) at the indicated doses and stimulated with buffer (no) or 0.2 µM CXCL12 (agonist). Four experiments in triplicate. *, P < 0.01, versus vehicle or P1; **, P < 0.001, versus vehicle or P1. Error bars show SDs.
Figure 4.
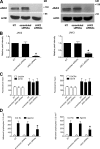
Human primary T lymphocytes lacking of JAK2 or JAK3 display reduced CXCL12-triggered adhesion to ICAM-1. (A) Immunoblot evaluation of JAK2 and JAK3 expression; lymphocytes were electroporated with a pool of four scrambled or JAK2 (left)- or JAK3 (right)-specific siRNAs and kept in culture for 24 h. Shown is the protein content compared with actin. The expression level of each protein was assessed in whole-cell lysates with anti-JAK2 or anti-JAK3 antibodies and then with an antiactin antibody for the loading control; representative experiment of five. (B) Quantification of immunoreactive bands. The relative ratio of the band intensity of total JAK2 (left) and JAK3 (right) was normalized to the level of NT intensity. Mean values of five experiments. (C) Flow cytometry measurement of CXCR4 (left) and CD18 (right) expression. Lymphocytes were treated as described in A; five experiments. (D) Static adhesion assay to ICAM-1. Lymphocytes were treated as in A and stimulated with buffer (no) or 0.2 µM CXCL12 (agonist); five experiments in triplicate. Error bars show SDs. *, P < 0.01, versus scrambled siRNAs.
Figure 5.
JAK2 and JAK3 regulate CXCL12-triggered underflow arrest on ICAM-1 and homing to secondary lymphoid organs of human primary T lymphocytes. Underflow adhesion assays. (A) Lymphocytes were treated with buffer (control), DMSO (vehicle), or 100 µM AG490 for 1 h; three experiments. Error bars show SDs. *, P < 0.01, versus vehicle. (B) Lymphocytes were treated with buffer (control), 40 µM Penetratin-1 (P1), or P1-TKIP for 1 h; three experiments. Error bars show SDs. *, P < 0.01, versus P1. (C) Lymphocytes were treated with buffer (control), DMSO (vehicle), or 200 µM WHI-P154 for 1 h; three experiments. Error bars show SDs. *, P < 0.01, versus vehicle. (D) Lymphocytes were electroporated with the pool of four scrambled or JAK2- or JAK3-specific siRNAs and kept in culture for 24 h; four experiments. Error bars show SDs. *, P < 0.01, versus scrambled siRNAs. In vivo homing to mouse Peyer’s patches. Human primary T lymphocytes were injected in the mouse tail vein, and the cell behavior on HEVs was analyzed in exteriorized mouse Peyer’s patches (PP). (E) Lymphocytes were treated as in A. (F) Lymphocytes were treated as in B. (G) Lymphocytes were as in C. Shown are percentages of arrested cells for the indicated times on total interacting cells. Values are means of four to five experiments. (E–G) Error bars show SEMs. *, P < 0.05; **, P < 0.01.
Figure 6.
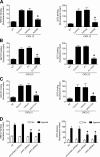
JAK2 and JAK3 mediate LFA-1 affinity triggering by CXCL12. (A) Lymphocytes were treated for 1 h with buffer (NT and control), DMSO (vehicle), or 100 µM AG490 and stimulated with 0.2 µM CXCL12. Different LFA-1 conformers were detected with the antibodies KIM127, detecting low-intermediate affinity state (left), or 327C, detecting high affinity state (right); five experiments in duplicate. *, P < 0.01, versus vehicle. (B) Lymphocytes were treated for 1 h with buffer (NT and control) or with 40 µM Penetratin-1 (P1) or P1-TKIP and stimulated with 0.2 µM CXCL12. Different LFA-1 conformers were detected as in A; five experiments in duplicate. *, P < 0.01, versus P1. (C) Lymphocytes were treated for 1 h with buffer (NT and control), DMSO (vehicle), or 200 µM WHI-P154 and stimulated with 0.2 µM CXCL12. Different LFA-1 conformers were detected as in A; four experiments in duplicate. *, P < 0.01, versus vehicle. (D) Lymphocytes were electroporated with the pool of four scrambled, JAK2- or JAK3-specific siRNAs, kept in culture for 24 h, and stimulated with buffer (no) or 0.2 µM CXCL12 (agonist). Different LFA-1 conformers were detected as in A; four experiments in duplicate. *, P < 0.01, versus scrambled siRNAs. Error bars show SDs.
Figure 7.
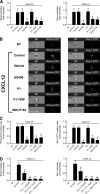
JAK2 and JAK3 mediate RhoA and Rac1 activation by CXCL12. (A) G-LISA assay detecting RhoA (left) and Rac1 (right) GTP-bound state. Lymphocytes were treated for 1 h with buffer (NT and control), DMSO (vehicle), 100 µM AG490, 40 µM Penetratin-1 (P1) or P1-TKIP, and 200 µM WHI-P154 and stimulated with 0.2 µM CXCL12. The percent fold increase of the RhoA and Rac1 activation was normalized to the level of NT intensity; mean of four experiments. *, P < 0.01, versus vehicle. (B) ImageStream analysis. Lymphocytes were treated and stimulated as in A; GTP-bound RhoA and Rac1 were detected with specific monoclonal antibodies (see methods) and fluorescent cells were detected and analyzed by ImageStream system IS-100. BF, bright-field channel. RhoA-GTP and Rac1-GTP are a 488-nm emission channel; representative experiment of three. Numbers identify acquired and analyzed individual cells. (C) ImageStream analysis. 5,000 cells, treated as in A and B, were analyzed. Fold increase of the RhoA-GTP (left)– and Rac1-GTP (right)–positive cells versus NT cells is shown; three experiments. *, P < 0.01, versus vehicle or P1. (D) G-LISA assays detecting RhoA (left) and Rac1 (right) GTP-bound state. Lymphocytes were treated with buffer (NT and control), with 2 µg/ml pertussis toxin (PTx) for 2 h, and with JAK inhibitors (100 µM AG490, 40 µM P1 or P1-TKIP, or 200 µM WHI-P154) for 1 h and then stimulated with 0.2 µM CXCL12. Fold increase of the RhoA (left) and Rac1 (right) activation was normalized to the level of NT intensity; mean of four experiments. *, P < 0.01, versus control; **, P < 0.001, versus control. Error bars show SDs.
Figure 8.
JAK2 and JAK3 mediate PLD1 and PIP5K1C activation by CXCL12. (A) Lymphocytes were treated for 1 h with buffer (NT and control), 100 µM AG490, 40 µM Penetratin-1 (P1) or P1-TKIP, or 200 µM WHI-P154 and stimulated with 0.2 µM CXCL12; mean of four experiments. Error bars show SDs. *, P < 0.01, versus control or P1. (B) Lymphocytes were treated as in A. Shown is an autoradiogram of 32P-labeled phosphoinositides. The values (CPM) at the bottom of the figure are quantifications of incorporated radioactivity in PtdIns(4,5)P2. Representative experiment of three.
Figure 9.
VAV1 mediates JAK-dependent LFA-1 activation and RhoA and Rac1 triggering by CXCL12. (A) Immunoblot evaluation of VAV1 expression. Lymphocytes were electroporated with a pool of four scrambled or VAV1-specific siRNAs and kept in culture for 24 h. Shown is the protein content compared with the total amount of actin. The expression level of VAV1 was assessed in whole-cell lysates with the anti-VAV1 antibody and then with the antiactin antibody for the loading control; representative experiment of four. (B) Quantification of immunoreactive bands. The relative ratio of the band intensity of total VAV1 was normalized to the level of NT intensity. Mean values of four experiments. *, P < 0.001, versus scrambled siRNAs. (C) Static adhesion assay to ICAM-1. Lymphocytes were treated as in A and stimulated with buffer (no) or 50 nM CXCL12 (agonist); four experiments in triplicate. *, P < 0.01, versus scrambled siRNAs. (D) Underflow adhesion assays. Lymphocytes were treated as in A; three experiments. *, P < 0.01, versus scrambled siRNAs. (E and F) Lymphocytes were treated as in A and stimulated with 25 nM CXCL12. Different LFA-1 conformers were detected with the antibodies KIM127, detecting low-intermediate affinity state (E), or 327C, detecting high affinity state (F); five experiments in duplicate. *, P < 0.001, versus scrambled siRNAs. (G) Time course of VAV1 phosphorylation. Lymphocytes were treated with buffer (NT) or with 0.2 µM CXCL12 for the indicated times. Lysates were immunoprecipitated with antiphosphotyrosine antibody and probed with an anti-VAV1 antibody; representative experiment of three. (H) Quantification of immunoreactive bands. The relative ratio of the band intensity of phospho-VAV1 was normalized to the level of NT. Mean values of three experiments. *, P < 0.01, versus NT. (I) Effect of JAK inhibitors on VAV1 activation. Lymphocytes were treated with buffer (NT and control), 100 µM AG490, 40 µM P1-TKIP, or 200 µM WHI-P154 for 1 h and stimulated with 0.2 µM CXCL12 for 120 s. Lysates were immunoprecipitated and probed as in G. The expression level of total VAV1 was assessed in whole-cell lysates with the anti-VAV1 antibody; representative experiment of three. (J) Quantification of immunoreactive bands. The relative ratio of the band intensity of phospho-VAV1 was normalized to the level of NT intensity. Mean values of three experiments. *, P < 0.01, versus control. (K) VAV1 activation is independent of heterotrimeric Gαi proteins. Lymphocytes were treated with buffer (NT and control) or 2 µg/ml pertussis toxin (PTx) for 2 h and stimulated with 0.2 µM CXCL12 for 120 s. Lysates were immunoprecipitated as in G. The expression level of total VAV1 was assessed in whole-cell lysates with anti-VAV1 antibody; representative experiment of three. (L) Quantification of immunoreactive bands. The relative ratio of the band intensity of phospho-VAV1 was normalized to the level of NT intensity. (M and N) G-LISA assays detecting RhoA (M) and Rac1 (N) activation (GTP-bound state). Lymphocytes were treated as in A and stimulated with buffer (NT) or 0.2 µM CXCL12. Fold increase of the RhoA (M) and Rac1 (N) activation was normalized by the level of NT intensity; mean of four experiments. *, P < 0.01, versus scrambled siRNAs. Error bars show SDs.
Figure 10.
JAK2, JAK3, RhoA, and PLD1 control Rap1A activation by CXCL12. Rap1A activation was measured by pull-down assay. (A) Lymphocytes were treated for 1 h with buffer (NT and control), Penetratin-1 (P1), 100 µM AG490, 40 µM P1-TKIP, and 200 µM WHI-P154 and stimulated with 0.2 µM CXCL12; (left) representative experiment of three. (B) Lymphocytes were treated for 1 h with buffer (NT and control) or the indicated doses of P1-RhoA-23-40 (P1-23-40) and stimulated with 0.2 µM CXCL12; (left) representative experiment of five. (C) Lymphocytes were treated for 1 h with buffer (NT and control), 10 µM TAT-Rac1–wild type (WT), TAT-Rac1-G12V (G12V), and TAT-Rac1-S17N (S17N) and stimulated with 0.2 µM CXCL12; (left) representative experiment of three. (D) Lymphocytes were treated for 1 h with buffer (NT and control), P1, or indicated doses of P1-PLD1 and stimulated with 0.2 µM CXCL12; (left) representative experiment of five. (right) The relative ratio of the band intensity of GTP-Rap1A in each experiment was normalized by the level of total Rap1A intensity. Error bars show SDs. *, P < 0.01, versus control.
Similar articles
- JAK2 tyrosine kinase mediates integrin activation induced by CXCL12 in B-cell chronic lymphocytic leukemia.
Montresor A, Toffali L, Mirenda M, Rigo A, Vinante F, Laudanna C. Montresor A, et al. Oncotarget. 2015 Oct 27;6(33):34245-57. doi: 10.18632/oncotarget.5196. Oncotarget. 2015. PMID: 26413812 Free PMC article. - SOS1, ARHGEF1, and DOCK2 rho-GEFs Mediate JAK-Dependent LFA-1 Activation by Chemokines.
Toffali L, Montresor A, Mirenda M, Scita G, Laudanna C. Toffali L, et al. J Immunol. 2017 Jan 15;198(2):708-717. doi: 10.4049/jimmunol.1600933. Epub 2016 Dec 16. J Immunol. 2017. PMID: 27986909 - DOCK2 is required for chemokine-promoted human T lymphocyte adhesion under shear stress mediated by the integrin alpha4beta1.
García-Bernal D, Sotillo-Mallo E, Nombela-Arrieta C, Samaniego R, Fukui Y, Stein JV, Teixidó J. García-Bernal D, et al. J Immunol. 2006 Oct 15;177(8):5215-25. doi: 10.4049/jimmunol.177.8.5215. J Immunol. 2006. PMID: 17015707 - Rho and Rap guanosine triphosphatase signaling in B cells and chronic lymphocytic leukemia.
Mele S, Devereux S, Ridley AJ. Mele S, et al. Leuk Lymphoma. 2014 Sep;55(9):1993-2001. doi: 10.3109/10428194.2013.866666. Epub 2013 Dec 31. Leuk Lymphoma. 2014. PMID: 24237579 Review. - Reprint of Neutrophil cell surface receptors and their intracellular signal transduction pathways.
Futosi K, Fodor S, Mócsai A. Futosi K, et al. Int Immunopharmacol. 2013 Dec;17(4):1185-97. doi: 10.1016/j.intimp.2013.11.010. Epub 2013 Nov 18. Int Immunopharmacol. 2013. PMID: 24263067 Review.
Cited by
- Platelet-derived Growth Factor Receptor-α Induces Contraction Knots and Inflammatory Pain-like Behavior in a Rat Model of Myofascial Trigger Points.
Liu Y, Jin F, Zhou L, Li X, Li X, Chen Q, Yang S, Sun J, Qi F. Liu Y, et al. Anesthesiology. 2024 Nov 1;141(5):929-945. doi: 10.1097/ALN.0000000000005167. Anesthesiology. 2024. PMID: 39058323 Free PMC article. - Rap1 organizes lymphocyte front-back polarity via RhoA signaling and talin1.
Ueda Y, Higasa K, Kamioka Y, Kondo N, Horitani S, Ikeda Y, Bergmeier W, Fukui Y, Kinashi T. Ueda Y, et al. iScience. 2023 Jul 11;26(8):107292. doi: 10.1016/j.isci.2023.107292. eCollection 2023 Aug 18. iScience. 2023. PMID: 37520697 Free PMC article. - Identification of hub genes in the subacute spinal cord injury in rats.
Yan L, Fu J, Dong X, Chen B, Hong H, Cui Z. Yan L, et al. BMC Neurosci. 2022 Aug 27;23(1):51. doi: 10.1186/s12868-022-00737-5. BMC Neurosci. 2022. PMID: 36030234 Free PMC article. - Thromboinflammation in Myeloproliferative Neoplasms (MPN)-A Puzzle Still to Be Solved.
Bhuria V, Baldauf CK, Schraven B, Fischer T. Bhuria V, et al. Int J Mol Sci. 2022 Mar 16;23(6):3206. doi: 10.3390/ijms23063206. Int J Mol Sci. 2022. PMID: 35328626 Free PMC article. Review. - RhoG's Role in T Cell Activation and Function.
Ahmad Mokhtar AM, Salikin NH, Haron AS, Amin-Nordin S, Hashim IF, Mohd Zaini Makhtar M, Zulfigar SB, Ismail NI. Ahmad Mokhtar AM, et al. Front Immunol. 2022 Feb 25;13:845064. doi: 10.3389/fimmu.2022.845064. eCollection 2022. Front Immunol. 2022. PMID: 35280994 Free PMC article. Review.
References
- Battistini L., Piccio L., Rossi B., Bach S., Galgani S., Gasperini C., Ottoboni L., Ciabini D., Caramia M.D., Bernardi G., et al. 2003. CD8+ T cells from patients with acute multiple sclerosis display selective increase of adhesiveness in brain venules: a critical role for P-selectin glycoprotein ligand-1. Blood. 101:4775–4782 10.1182/blood-2002-10-3309 - DOI - PubMed
- Bergmeier W., Goerge T., Wang H.W., Crittenden J.R., Baldwin A.C., Cifuni S.M., Housman D.E., Graybiel A.M., Wagner D.D. 2007. Mice lacking the signaling molecule CalDAG-GEFI represent a model for leukocyte adhesion deficiency type III. J. Clin. Invest. 117:1699–1707 10.1172/JCI30575 - DOI - PMC - PubMed
Publication types
MeSH terms
Substances
LinkOut - more resources
Full Text Sources
Other Literature Sources
Molecular Biology Databases
Research Materials
Miscellaneous


