Maintenance of basal levels of autophagy in Huntington's disease mouse models displaying metabolic dysfunction - PubMed (original) (raw)
Maintenance of basal levels of autophagy in Huntington's disease mouse models displaying metabolic dysfunction
Barbara Baldo et al. PLoS One. 2013.
Abstract
Huntington's disease (HD) is a fatal neurodegenerative disorder caused by an expanded polyglutamine repeat in the huntingtin protein. Neuropathology in the basal ganglia and in the cerebral cortex has been linked to the motor and cognitive symptoms whereas recent work has suggested that the hypothalamus might be involved in the metabolic dysfunction. Several mouse models of HD that display metabolic dysfunction have hypothalamic pathology, and expression of mutant huntingtin in the hypothalamus has been causally linked to the development of metabolic dysfunction in mice. Although the pathogenic mechanisms by which mutant huntingtin exerts its toxic functions in the HD brain are not fully known, several studies have implicated a role for the lysososomal degradation pathway of autophagy. Interestingly, changes in autophagy in the hypothalamus have been associated with the development of metabolic dysfunction in wild-type mice. We hypothesized that expression of mutant huntingtin might lead to changes in the autophagy pathway in the hypothalamus in mice with metabolic dysfunction. We therefore investigated whether there were changes in basal levels of autophagy in a mouse model expressing a fragment of 853 amino acids of mutant huntingtin selectively in the hypothalamus using a recombinant adeno-associate viral vector approach as well as in the transgenic BACHD mice. We performed qRT-PCR and Western blot to investigate the mRNA and protein expression levels of selected autophagy markers. Our results show that basal levels of autophagy are maintained in the hypothalamus despite the presence of metabolic dysfunction in both mouse models. Furthermore, although there were no major changes in autophagy in the striatum and cortex of BACHD mice, we detected modest, but significant differences in levels of some markers in mice at 12 months of age. Taken together, our results indicate that overexpression of mutant huntingtin in mice do not significantly perturb basal levels of autophagy.
Conflict of interest statement
Competing Interests: The authors have declared that no competing interests exist.
Figures
Figure 1. Body weight changes in mice injected with rAAV-htt853 vectors and validation of htt expression.
A) Mice bilaterally injected with rAAV5-htt853-79Q displayed increased body weight compared to mice injected with rAAV5-htt853-18Q and uninjected animals already 2 weeks post injection. Animals bilaterally injected with rAAV5-htt853-18Q showed increased body weight compared to uninjected controls 6 weeks post injection (n = 14/group; * and #p<0.05 after Bonferroni post-hoc test; *statistical significant difference compared to uninjected controls while # expresses statistical significance compared to rAAV5-htt853-18Q). B) qRT-PCR verified the expression of htt853-18Q and htt853-79Q relative to uninjected controls in mice 8 weeks post-injection of rAAV5-htt853 vectors (n = 7/group). C) Representative Western blot detected the expression of endogenous wt htt as well as htt853-18Q and htt853-79Q in mice 8 weeks post injection of rAAV5-htt853 vectors.
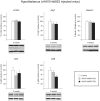
Figure 2. Maintenance of basal levels of autophagy in mice overexpressing htt fragments in the hypothalamus.
The expression levels of selected autophagy markers were analyzed by Western blot in mice bilaterally injected with rAAV5-htt853-18Q or rAAV5-htt853-79Q and compared to uninjected controls 8 weeks post injection (n = 6–7/group). The data displayed maintenance of the autophagy flux, despite the presence of a clear metabolic phenotype in the injected mice. The data in the graphs are expressed as mean ± SEM relative to the uninjected controls. The Western blots are representative of one sample for each group.
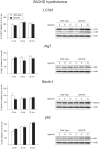
Figure 3. Basal levels of autophagy in the hypothalamus of BACHD mice.
The expression levels of selected autophagy markers were analyzed by Western blot in hypothalamic tissue from BACHD mice at 2, 6 and 12 months of age and compared with gender- and age-matched controls (n = 3–6/group). The data showed a substantial maintenance of the autophagy flux, despite the presence of a metabolic phenotype in the BACHD mice already at early time points. The expression level of a marker for selective autophagy p62 showed a progressive accumulation in both BACHD and wt mice (Bonferroni post-hoc test: wt p = 0.003, BACHD p = 0.02). The data in the graphs are expressed as mean ± SEM, relative to the 2 months wt controls. The Western blots are representative of one sample for each group.
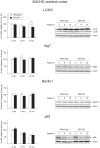
Figure 4. Basal levels of autophagy in the cerebral cortex of BACHD mice.
The expression levels of selected autophagy markers were analyzed by Western blot in cortical tissue from BACHD mice at 2, 6 and 12 months of age and compared with gender- and age-matched controls (n = 3–6/group). The data show that the basal levels of autophagy were substantially unaltered in the cortex of BACHD mice with the exception of the LC3II/I ratio, which is reduced in 12 months old BACHD when compared with wt controls (Genotype effect in two-factor ANOVA: F(1,25) = 4.715, p = 0.040; Student’s un-paired T-test as post hoc test: p = 0.006 at 12 months). The data in the graphs are expressed as mean ± SEM, relative to the 2 months wt controls. The Western blots are representative of one sample for each group.
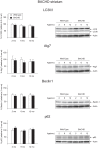
Figure 5. Basal levels of autophagy in the striatum of BACHD mice.
Selected autophagy markers were analyzed by Western blot of striatal tissue from BACHD mice at 2, 6 and 12 months of age and compared with gender- and age-matched controls (n = 3–6/group). The data show that the basal levels of autophagy were unaltered in the striatum of BACHD mice. The data in the graphs are expressed as mean ± SEM, relative to the 2 months wt controls. The Western blots are representative of one sample for each group.
Similar articles
- Effects of deletion of mutant huntingtin in steroidogenic factor 1 neurons on the psychiatric and metabolic phenotype in the BACHD mouse model of Huntington disease.
Baldo B, Cheong RY, Petersén Å. Baldo B, et al. PLoS One. 2014 Oct 1;9(10):e107691. doi: 10.1371/journal.pone.0107691. eCollection 2014. PLoS One. 2014. PMID: 25271967 Free PMC article. - Hypothalamic expression of huntingtin causes distinct metabolic changes in Huntington's disease mice.
Dickson E, Soylu-Kucharz R, Petersén Å, Björkqvist M. Dickson E, et al. Mol Metab. 2022 Mar;57:101439. doi: 10.1016/j.molmet.2022.101439. Epub 2022 Jan 7. Mol Metab. 2022. PMID: 35007790 Free PMC article. - Mutant huntingtin causes metabolic imbalance by disruption of hypothalamic neurocircuits.
Hult S, Soylu R, Björklund T, Belgardt BF, Mauer J, Brüning JC, Kirik D, Petersén Å. Hult S, et al. Cell Metab. 2011 Apr 6;13(4):428-439. doi: 10.1016/j.cmet.2011.02.013. Cell Metab. 2011. PMID: 21459327 - Genetic manipulations of mutant huntingtin in mice: new insights into Huntington's disease pathogenesis.
Lee CY, Cantle JP, Yang XW. Lee CY, et al. FEBS J. 2013 Sep;280(18):4382-94. doi: 10.1111/febs.12418. Epub 2013 Jul 31. FEBS J. 2013. PMID: 23829302 Free PMC article. Review. - Hypothalamic alterations in Huntington's disease patients: comparison with genetic rodent models.
van Wamelen DJ, Aziz NA, Roos RA, Swaab DF. van Wamelen DJ, et al. J Neuroendocrinol. 2014 Nov;26(11):761-75. doi: 10.1111/jne.12190. J Neuroendocrinol. 2014. PMID: 25074766 Review.
Cited by
- A triazole derivative elicits autophagic clearance of polyglutamine aggregation in neuronal cells.
Hsieh CH, Lee LC, Leong WY, Yang TC, Yao CF, Fang K. Hsieh CH, et al. Drug Des Devel Ther. 2016 Sep 14;10:2947-2957. doi: 10.2147/DDDT.S111903. eCollection 2016. Drug Des Devel Ther. 2016. PMID: 27695292 Free PMC article. - A role for autophagy in Huntington's disease.
Croce KR, Yamamoto A. Croce KR, et al. Neurobiol Dis. 2019 Feb;122:16-22. doi: 10.1016/j.nbd.2018.08.010. Epub 2018 Aug 24. Neurobiol Dis. 2019. PMID: 30149183 Free PMC article. Review. - Proteostasis in striatal cells and selective neurodegeneration in Huntington's disease.
Margulis J, Finkbeiner S. Margulis J, et al. Front Cell Neurosci. 2014 Aug 7;8:218. doi: 10.3389/fncel.2014.00218. eCollection 2014. Front Cell Neurosci. 2014. PMID: 25147502 Free PMC article. Review. - Hypothalamic overexpression of mutant huntingtin causes dysregulation of brown adipose tissue.
Soylu-Kucharz R, Adlesic N, Baldo B, Kirik D, Petersén Å. Soylu-Kucharz R, et al. Sci Rep. 2015 Sep 30;5:14598. doi: 10.1038/srep14598. Sci Rep. 2015. PMID: 26419281 Free PMC article. - Microarray profiling of hypothalamic gene expression changes in Huntington's disease mouse models.
Dickson E, Dwijesha AS, Andersson N, Lundh S, Björkqvist M, Petersén Å, Soylu-Kucharz R. Dickson E, et al. Front Neurosci. 2022 Nov 3;16:1027269. doi: 10.3389/fnins.2022.1027269. eCollection 2022. Front Neurosci. 2022. PMID: 36408416 Free PMC article.
References
- The Huntington’s Disease Collaborative Research Group (1993) A novel gene containing a trinucleotide repeat that is expanded and unstable on Huntington’s disease chromosomes. Cell 72: 971–983. - PubMed
- Ross CA, Tabrizi SJ (2011) Huntington’s disease: from molecular pathogenesis to clinical treatment. Lancet Neurol 10: 83–98. - PubMed
- Novak MJ, Tabrizi SJ (2011) Huntington’s disease: clinical presentation and treatment. Int Rev Neurobiol 98: 297–323. - PubMed
- Duff K, Paulsen JS, Beglinger LJ, Langbehn DR, Stout JC (2007) Psychiatric symptoms in Huntington’s disease before diagnosis: the predict-HD study. Biol Psychiatry 62: 1341–1346. - PubMed
Publication types
MeSH terms
Substances
Grants and funding
This work was supported by grants from the Swedish Medical Research Council (K2011-62X-20404-05-6), the Ragnar Söderberg foundation and the province of Skåne state grants. The funders had no role in study design, data collection and analysis, decision to publish or preparation of the manuscript.
LinkOut - more resources
Full Text Sources
Other Literature Sources
Medical
Molecular Biology Databases


