Intravascular staining for discrimination of vascular and tissue leukocytes - PubMed (original) (raw)
Intravascular staining for discrimination of vascular and tissue leukocytes
Kristin G Anderson et al. Nat Protoc. 2014 Jan.
Abstract
Characterization of the cellular participants in tissue immune responses is crucial to understanding infection, cancer, autoimmunity, allergy, graft rejection and other immunological processes. Previous reports indicate that leukocytes in lung vasculature fail to be completely removed by perfusion. Several studies suggest that intravascular staining may discriminate between tissue-localized and blood-borne cells in the mouse lung. Here we outline a protocol for the validation and use of intravascular staining to define innate and adaptive immune cells in mice. We demonstrate application of this protocol to leukocyte analyses in many tissues and we describe its use in the contexts of lymphocytic choriomeningitis virus and Mycobacterium tuberculosis infections or solid tumors. Intravascular staining and organ isolation usually takes 5-30 min per mouse, with additional time required for any subsequent leukocyte isolation, staining and analysis. In summary, this simple protocol should help enable interpretable analyses of tissue immune responses.
Figures
Figure 1
Evidence that perfusion should be avoided. (a) Anti-CD45.2 mAb was injected i.v. via the tail vein of naive C57BL/6 mice 3 min before perfusion and lymphocyte isolation. Naive CD4 + and CD8 + T cells and B cells were identified by flow cytometry, as indicated and examined for labeling with injected anti-CD45.2 mAb. Representative of 12 mice from two experiments. (b) At 15 d after i.t. LCMV infection, lungs from P14 chimeras were perfused or left unperfused. Representative immunofluorescence images of iBALT or aggregate structures in lungs stained with anti-collagen type IV (green), anti-PNAd (red), anti-Thy1.1 (gray) and DAPI (blue). Arrow designates PNAd + high endothelial venule (HEV). Scale bars, 100 µm. Representative of two experiments totaling 10 mice per condition. *P = 0.05, **P < 0.01, using a two-tailed Student’s t test with a 95% confidence interval. Error bars indicate s.e.m.
Figure 2
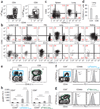
Technical considerations for intravascular staining. (a–d) Thy1.1 + P14 CD8 T cell chimeras (a), CD45.1 + SMARTA CD4 T cell chimeras (b) or CD45.2 + C57BL/6 mice were infected with LCMV i.t. (c,d). (a–g) After 12–15 d, mice were injected i.v. with the indicated mAb (clones are in parentheses), killed 3 min later and lymphocytes were either isolated and further stained ex vivo for flow cytometric analysis (a–d) or tissue sections were examined by epifluorescence microscopy (e–g). (a–d) Plots are gated on CD8P+ and Thy1.1 + (a), CD4 (clone RM4–5) + and CD45.1 + (b), CD45.2 + (clone 104, stained ex vivo), CD8α+ and H2-Db/gp33–41 MHC I tetramer + (c) or CD8α+ (stained ex vivo) and H2-Db/gp33–41 MHC I tetramer + lymphocytes (d). Plots are representative of at least three experiments and nine mice per condition. (e–g) mAb specific for collagen type IV (green) and CD8β or CD4 (cyan, as indicated) stained ex vivo, and the indicated i.v. injected mAb (red) on spleen sections. Images are representative of at least three experiments and eight mice per condition. Scale bars, 100 µm. (h) At 30 d after i.t. LCMV infection of C57BL/6 mice, anti-CD45.2 i.v. mAb staining intensity was examined on CD8α + H2-Db/gp33–41 MHC I tetramer + lymphocytes isolated from blood (PBL, red), spleen (blue) and lung (black). Representative of three experiments totaling nine mice.
Figure 3
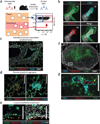
Intravascular staining is confined to vascular cells. (a) Schematic of intravascular staining. (b–g) Anti-CD31 and anti-CD45.2 (b) or anti-CD45.2 mAb alone (c–g) was injected i.v. into C57BL/6 mice 12 d after i.t. LCMV infection. (b) Confocal imaging of lung, anti-CD31 i.v. (green), anti-CD45.2 i.v. (red), anti-CD8β (cyan) and DAPI (gray). Representative of three experiments totaling four mice. (c–e) iBALT (c), alveolar lymphoid aggregates (d) and intraepithelial lymphocytes (IEL) (e) in the lung 12 d after i.v. LCMV infection. Orange arrows indicate sample IELs. (f) Inguinal lymph node sections showing anti-CD45.2 i.v. mAb staining (red) and ex vivo anti-CD31 (cyan), anti-CD8β (green) and DAPI (gray). (g) White inset from f without DAPI displayed. Yellow arrows indicate anti-CD45.2 i.v. and anti-CD8β mAb co-staining. Scale bars, 100 µm. (c–g) Data are representative of three experiments totaling nine mice.
Figure 4
Intravascular staining without perfusion is sufficient to reveal unique lymphocyte subsets in tissues. (a–d) C57BL/6 mice were injected with anti-CD45.2 mAb i.v. 12 d after i.t. LCMV infection. Lymphocytes were isolated and LCMV-specific CD4 + and CD8 + T cells were identified with I-Ab/gp66–77 and H2-Db/gp33–41 MHC tetramers, respectively. (a) Representative tetramer staining in spleen. (b,c) Anti-CD45.2 i.v. and anti-CD69 mAb staining of H2-Db/gp33–41-gated CD8 (b) or I-Ab/gp66–77 CD4 (c) T cells isolated from the indicated compartments. (d) Frequency of tetramer-positive cells protected from i.v. mAb staining in lung. Plots are representative of two experiments totaling nine mice. ****P < 0.0001, Student’s t test. Error bars indicate s.e.m. (e–h) _M. tuberculosis_–specific CD4 + and CD8 + T cells isolated from lung 24 d after infection with 100–150 c.f.u. of aerosolized M. tuberculosis (strain H37Rv) were identified by staining with I-AbESAT-61–20 and KbTB10.3/44–11 MHC tetramers, respectively. (e) Representative anti-CD45.2 i.v. mAb and MHC tetramer staining. (f,g) PD-1 expression on CD4 + (f) and CD8 + (g) T cells from lungs. Shaded histograms are anti-CD45.2 i.v. mAb −, and black line indicates anti-CD45.2 i.v. mAb + . (h) Geometric mean fluorescence intensity (geoMFI) of PD-1 expression on naive (CD44lo) or M. tuberculosis MHC tetramer + CD4 and CD8 T cells. Plots are representative of two experiments totaling nine mice. ****P < 0.0001, Student’s t test. n.s., not significant. Error bars indicate s.e.m.
Figure 5
Intravascular staining indicates anatomic localization of B cells. Anti-CD45.2 mAb was injected i.v. into C57Bl/6 mice 12 d after i.t. LCMV infection. (a) Gating strategy (the letters in panel a correspond to panels b–f). (a–f) Lymphocytes were isolated from spleen, and anti-CD45.2 mAb staining was examined on the following B cell lineages that were identified by 13-parameter flow cytometry (defining markers indicated in parentheses): Ab-secreting cells (intracellular Ig + , IgM − , IgD − ) (b), B1 B cells (intracellular Ig + , CD19 + , B220 , CD43 + ) (c), germinal center B cells (intracellular Ig + , CD19 + , B220 + , CD43 , CD38 , GL7 + ) (d), unswitched naïve and memory B cells (intracellular Ig + , CD19 + , B220 + , CD43 , CD38 + , GL7 − ) (e) or isotype-switched memory B cells (intracellular Ig + , CD19 + , B220 + , CD43 − , CD38 + , GL7 − , IgM − , IgD − ) (f). Plots are representative of three experiments totaling nine mice.
Figure 6
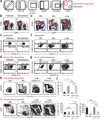
Intravascular staining during Mtb infection reveals tissue-specific myeloid cell subsets. (a) Gating strategy for myeloid neutrophils and mononuclear phagocytes. (b) Neutrophils and mononuclear phagocytes were recovered from the lungs of naive C57BL/6 mice with or without perfusion. (c,d) Intravascular staining of neutrophils (c) or mononuclear phagocytes (d) from lungs of perfused (left plots) or unperfused (right plots) naive mice. Representative of nine mice per condition from two independent experiments. (e–j) Intravascular staining of myeloid and lymphoid cells isolated from PBL, BAL or lungs of C57BL/6 mice 24 d after M. tuberculosis infection without perfusion. (f,g) Intravascular staining of neutrophils (f) or mononuclear phagocytes (g). (h,i) CD11b and CD103 (h) or CD11c and Ly6C staining (i) on mononuclear phagocytes isolated from the indicated compartments. (j) Summary of CD68 + mononuclear phagocyte subsets as defined in h and i. Plots are representative of two experiments totaling nine mice. *P < 0.05. ****P < 0.0001, Student’s t test. n.s., not significant. Error bars indicate s.e.m.
Figure 7
Intravascular staining reveals myeloid and lymphoid tissue–specific subsets in a mouse renal adenocarcinoma model. Renca cells were injected into the kidney of BALB/c female mice in order to establish solid tumors. (a) After 14 d, kidneys were removed and sections were stained ex vivo for cytokeratin 8 and 18 (green), collagen type IV (red), CD31 (cyan) and DAPI (gray). Scale bar, 250 µm. Representative of five mice analyzed from three experiments. (b–f) Anti-CD45.2 mAb was injected i.v. 14 d after intrarenal Renca cell injection. (b) CD69 and CD103 expression on CD4 and CD8 T cells isolated from PBL, tumor-bearing kidney and contralateral kidney. (c,d) Frequency of CD69 + /CD103 + CD4 T cells (c) and CD69 + CD8 T cells (d) from tumor-bearing mice. (e) PD-1 expression on CD4 and CD8 T cells isolated from PBL (gray) and tumor-bearing kidney (anti-CD45.2 i.v. mAb + in red and anti-CD45.2 i.v. mAb− in blue). (f) Gating strategy for MDSCs. (g) MDSCs were isolated from tumor-bearing kidneys 14 d after Renca cell injection. CD45.2 i.v. mAb staining of Ly6G and Ly6G + MDSCs are shown. (h) Percentage of Ly6G − and Ly6G + MDSCs from tumor-bearing kidneys protected from CD45.2 i.v. mAb staining. All plots are representative of 8–11 mice from three experiments. *P < 0.05, **P < 0.01, ***P < 0.0005, ****P < 0.0001, Student’s t test. Error bars indicate s.e.m.
Similar articles
- Evaluation of the Adaptive Immune Response to Respiratory Syncytial Virus.
Knudson CJ, Weiss KA, Stoley ME, Varga SM. Knudson CJ, et al. Methods Mol Biol. 2016;1442:231-43. doi: 10.1007/978-1-4939-3687-8_17. Methods Mol Biol. 2016. PMID: 27464699 - The pulmonary localization of virus-specific T lymphocytes is governed by the tissue tropism of infection.
Knudson CJ, Weiss KA, Hartwig SM, Varga SM. Knudson CJ, et al. J Virol. 2014 Aug;88(16):9010-6. doi: 10.1128/JVI.00329-14. Epub 2014 Jun 4. J Virol. 2014. PMID: 24899187 Free PMC article. - Measurement of leukocyte trafficking kinetics in macaques by serial intravascular staining.
Potter EL, Gideon HP, Tkachev V, Fabozzi G, Chassiakos A, Petrovas C, Darrah PA, Lin PL, Foulds KE, Kean LS, Flynn JL, Roederer M. Potter EL, et al. Sci Transl Med. 2021 Jan 13;13(576):eabb4582. doi: 10.1126/scitranslmed.abb4582. Sci Transl Med. 2021. PMID: 33441427 - Role of innate cytokines in mycobacterial infection.
Cooper AM, Mayer-Barber KD, Sher A. Cooper AM, et al. Mucosal Immunol. 2011 May;4(3):252-60. doi: 10.1038/mi.2011.13. Epub 2011 Mar 23. Mucosal Immunol. 2011. PMID: 21430655 Free PMC article. Review. - Host defense mechanisms against Mycobacterium tuberculosis.
Chai Q, Lu Z, Liu CH. Chai Q, et al. Cell Mol Life Sci. 2020 May;77(10):1859-1878. doi: 10.1007/s00018-019-03353-5. Epub 2019 Nov 13. Cell Mol Life Sci. 2020. PMID: 31720742 Free PMC article. Review.
Cited by
- mRNA vaccine-induced IgG mediates nasal SARS-CoV-2 clearance in mice.
Fricke C, Ulrich L, Kochmann J, Gergen J, Kovacikova K, Roth N, Beer J, Schnepf D, Mettenleiter TC, Rauch S, Petsch B, Hoffmann D, Beer M, Corleis B, Dorhoi A. Fricke C, et al. Mol Ther Nucleic Acids. 2024 Oct 15;35(4):102360. doi: 10.1016/j.omtn.2024.102360. eCollection 2024 Dec 10. Mol Ther Nucleic Acids. 2024. PMID: 39524696 Free PMC article. - Manipulating the EphB4-ephrinB2 axis to reduce metastasis in HNSCC.
Abdelazeem KNM, Nguyen D, Corbo S, Darragh LB, Matsumoto MW, Van Court B, Neupert B, Yu J, Olimpo NA, Osborne DG, Gadwa J, Ross RB, Nguyen A, Bhatia S, Kapoor M, Friedman RS, Jacobelli J, Saviola AJ, Knitz MW, Pasquale EB, Karam SD. Abdelazeem KNM, et al. Oncogene. 2024 Nov 3. doi: 10.1038/s41388-024-03208-9. Online ahead of print. Oncogene. 2024. PMID: 39489818 - A novel outer membrane vesicle adjuvant improves vaccine protection against Bordetella pertussis.
Galeas-Pena M, Hirsch A, Kuang E, Hoffmann J, Gellings P, Brown JB, Limbert VM, Callahan CL, McLachlan JB, Morici LA. Galeas-Pena M, et al. NPJ Vaccines. 2024 Oct 16;9(1):190. doi: 10.1038/s41541-024-00990-1. NPJ Vaccines. 2024. PMID: 39406780 Free PMC article. - CD4+ T cell help during early acute hepacivirus infection is critical for viral clearance and the generation of a liver-homing CD103+CD49a+ effector CD8+ T cell subset.
Lopez-Scarim J, Mendoza D, Nambiar SM, Billerbeck E. Lopez-Scarim J, et al. PLoS Pathog. 2024 Oct 11;20(10):e1012615. doi: 10.1371/journal.ppat.1012615. eCollection 2024 Oct. PLoS Pathog. 2024. PMID: 39392861 Free PMC article. - Injury-induced myosin-specific tissue-resident memory T cells drive immune checkpoint inhibitor myocarditis.
Kalinoski H, Daoud A, Rusinkevich V, Jurčová I, Talor MV, Welsh RA, Hughes D, Zemanová K, Stříž I, Hooper JE, Kautzner J, Peichl P, Melenovský V, Won T, Čiháková D. Kalinoski H, et al. Proc Natl Acad Sci U S A. 2024 Oct 15;121(42):e2323052121. doi: 10.1073/pnas.2323052121. Epub 2024 Oct 8. Proc Natl Acad Sci U S A. 2024. PMID: 39378095
References
- Andrian von UH, Mackay CR. T-cell function and migration Two sides of the same coin. N. Engl. J. Med. 2000;343:1020–1034. - PubMed
Publication types
MeSH terms
Substances
Grants and funding
- R37 AI084913/AI/NIAID NIH HHS/United States
- ZIA AI001171-02/ImNIH/Intramural NIH HHS/United States
- T90 DE022732/DE/NIDCR NIH HHS/United States
- T90DE022732/DE/NIDCR NIH HHS/United States
- R01 CA109446/CA/NCI NIH HHS/United States
- AI084913-01/AI/NIAID NIH HHS/United States
- R01 AI084913/AI/NIAID NIH HHS/United States
- CA109446/CA/NCI NIH HHS/United States
- DP2 OD006467/OD/NIH HHS/United States
- T32 AI007610/AI/NIAID NIH HHS/United States
LinkOut - more resources
Full Text Sources
Other Literature Sources


