Dual engagement of the NLRP3 and AIM2 inflammasomes by plasmodium-derived hemozoin and DNA during malaria - PubMed (original) (raw)
Dual engagement of the NLRP3 and AIM2 inflammasomes by plasmodium-derived hemozoin and DNA during malaria
Parisa Kalantari et al. Cell Rep. 2014.
Abstract
Hemozoin (Hz) is the crystalline detoxification product of hemoglobin in Plasmodium-infected erythrocytes. We previously proposed that Hz can carry plasmodial DNA into a subcellular compartment that is accessible to Toll-like receptor 9 (TLR9), inducing an inflammatory signal. Hz also activates the NLRP3 inflammasome in primed cells. We found that Hz appears to colocalize with DNA in infected erythrocytes, even before RBC rupture or phagolysosomal digestion. Using synthetic Hz coated in vitro with plasmodial genomic DNA (gDNA) or CpG oligodeoxynucleotides, we observed that DNA-complexed Hz induced TLR9 translocation, providing a priming and an activation signal for inflammasomes. After phagocytosis, Hz and DNA dissociate. Hz subsequently induces phagolysosomal destabilization, allowing phagolysosomal contents access to the cytosol, where DNA receptors become activated. Similar observations were made with Plasmodium-infected RBCs. Finally, infected erythrocytes activated both the NLRP3 and AIM2 inflammasomes. These observations suggest that Hz and DNA work together to induce systemic inflammation during malaria.
Copyright © 2014 The Authors. Published by Elsevier Inc. All rights reserved.
Figures
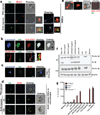
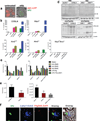
Figure 1. Hemozoin colocalizes with DNA in vivo is internalized into the phagolysosome where it has the capacity to prime macrophages and activate the NLRP3 inflammasome
(a)Erythrocytes from PBS injected and BrdU injected P. berghei ANKA infected mice were stained with FITC-conjugated anti-BrdU antibody and subjected to confocal microscopy. Boxed areas in middle and bottom panels are enlarged (3×). Scale bar: 3µm (top panel), 7.8µm (middle panel) and 7.8µm (bottom panel). (b) Top: sHz (100µg/ml) was incubated with CpG–Alexa 647 (5µg/ml) for 2h. The complex was washed 3× with PBS before incubation with immortalized BMDMs and imaged by confocal microscopy after 30 min. Scale bar: 5µm. Bottom: Confocal microscopy of immortalized BMDMs stably transduced with Rab4-YFP, stimulated with sHz crystals (100µg/ml) for 2h. scale bar: 15µm. The boxed areas are enlarged on the right, demonstrating lack of co localization. (c) RBC from BrdU injected P. berghei ANKA infected mice were stained and prepared as in Fig. 1a. BMDMs were incubated with iRBCs (MOI: 5 to 1) × 1h and stained with lysotracker. Scale bar: 5µm. (d) RBC from PBS- or BrdU-injected P. berghei ANKA infected mice were incubated with BMDMs (MOI: 5 to 1), stained with FITC-conjugated anti-BrdU antibody and subjected to confocal microscopy after 1 or 12h. Scale bar: 20µm (top panel), 20µm (bottom panel). (e) BMDMs stably expressing ASC-CFP were treated with sHz/CpG (5µg/ml), sHz only (100µg/ml) or LPS (100ng/ml) × 2 h and then treated with nigericin (10µM), a K+ ionophore that activates NRLP3. The formation of ASC pyroptosomes was visualized by confocal microscopy. Fields are representative of at least 10 fields of view and 3 independent experiments. Scale bars from left to right: 15, 10, 5 and 5 µm; sHz (green) was visualized using reflection microscopy. (f) Immunoblot analysis of IL-1β cleavage to mature IL-1β (p17) in supernatants (SN) and cell extracts (Cell) from wt murine BMDMs stimulated as described in (g). (g) ELISA of released IL-1β by immortalized BMDMs from wt, _Nlrp3_−/−, _Asc_−/− and _casp1_−/− macrophages which were unprimed or primed or with LPS (100ng/ml) for 2 h, and then left unstimulated or stimulated for an additional 12 h with sHz, sHz/CpG (sHz: 100µg/ml and CpG: 2.5µg/ml and 5µg/ml), CpG (2.5µg/ml and 5µg/ml) or transfected with 1.5 µg/ml poly (dAdT). Nigericin (Nig) was used as a control. Poly (dAdT) was used as an AIM2 inflammasome activating control. Data are presented as mean ± SD of triplicates and are representative of 3 independent experiments. See also Fig. S1.
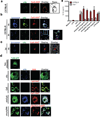
Figure 2. Synthetic Hz/CpG or sHz/Pf gDNA induce TLR9 translocation to the phagosome, followed by TLR9-dependent release of IL-1β
(a) sHz/CpG-A 647 (5µg/ml) was added to the cells and subjected to confocal microscopy after 6h of incubation. Scale bar: 5µm. (b) BMDMs were incubated with sHz/CpG-A 647 (5µg/ml) × 4h or 6h and stained with LysoTracker (blue). Scale bar: 10µm (top panel) and 5µm (bottom panel). Boxed area in main image at right is enlarged (2.5×); The arrow (in both top and bottom panel) indicates Hz in the cytosol. (c) “3d” macrophages, functionally deficient in TLRs 3,7 and 9, were incubated with CpG-A647 DNA × 4h. Scale bar: 10µm. Fields are representative of at least 10 fields of view and three independent experiments. (d) Immortalized BMDMs isolated from transgenic TLR9-GFP mice were left untreated or incubated with sHz (100µg/ml), CpG-Alexa 647 (5µg/ml), sHz/CpG-Alexa 647 (5µg/ml) and sHz/Pf gDNA-Syto60 (4µg/ml) for 30 min and living cells were visualized by confocal microscopy. Fields are representative of at least 10 fields of view and three independent experiments. Scale bars from top to bottom: 5µm, 15µm, 5µm, 15µm and 5µm. (e) ELISA of IL-1β production by wt and _Tlr9_−/− BMDMs, primed or unprimed for 2 h with LPS (100ng/ml) and then left unstimulated or stimulated with indicated amounts of sHz, sHz/CpG complex, sHz/Pf gDNA or nigericin (10µM). Supernatants were analyzed for IL-1β 12h after stimulation. Data are presented as mean ± SD of triplicates and are representative of 3 independent experiments. See also Figure S2.
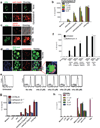
Figure 3. Phagocytosis of crystals leads to phagolysosomal destabilization and is necessary for IL-1β release
(a) Confocal microscopy of BMDMs stimulated with sHz (100µg/ml) for 2h in the absence and presence of cytochalasin D (2.5 µM). Cell membranes were stained with cell mask (red). Scale bar: 5µm (top) and 20µm (bottom). (b) ELISA of the release of IL-1β into supernatants of immortalized BMDMs left untreated or treated with increasing concentration of cytochalasin D and then stimulated for 12 h with sHz or sHz/CpG complex. (c) Confocal microscopy of immortalized BMDMs incubated with A546-Dextran 10kDa for 45 min and then either left untreated or stimulated with 100µM nHz for 4 h. Scale bar (top and bottom panels: 10µm) (d) Macrophages were stained with acridine orange (0.05 mg/ml) for 10 min and then stimulated with nHz (100µM). 4h after stimulation, cells were analyzed by confocal microscopy. Fields are representative of at least 10 fields of view and three independent experiments. Scale bar: 10µm (top) and 20µm (bottom). Boxed area is enlarged (9×). (e) FACS analysis of immortalized BMDMs stained with acridine orange and treated with indicated amounts of nHz × 4h. The numbers above the brackets indicate the % macrophages that have lost acridine orange staining. (f) ELISA of released IL-1β from unprimed or LPS-primed immortalized BMDMs pretreated with indicated concentrations of bafilomycin A × 2 h and then stimulated with sHz, sHz/CpG or Silica (500µg/ml) × 12 h. (g) ELISA of released IL-1β by wt, _ctsb_−/− and _ctsl_−/− BMDMs left unstimulated or stimulated with sHz (100µg/ml) or sHz/CpG for 12 h. (h) ELISA of IL-1β production by unprimed or LPS-primed immortalized murine BMDMs pretreated with indicated concentrations of Uricase for 2 h, stimulated with LPS (100ng/ml) for another 2 h and then incubated with MSU (500µg/ml), sHz (100µg/ml) and sHz/CpG (5µg/ml) for 12 h. Data are presented as mean ± SD of triplicates and are representative of 3 independent experiments. See also Fig. S3.
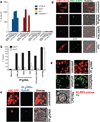
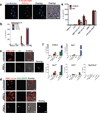
Figure 4. Pf gDNA induces IL-1β through activation of AIM2 inflammasome
(a) 50 and 100 ng/ml of Pf gDNA (3D7) were transfected using lipofectamine into LPS primed (100ng/ml × 2h) immortalized murine wt, _Nlrp3_−/−, _Asc_−/− and _casp1_−/− BMDMs. After 12h, IL-1β was measured in the culture supernatants by ELISA. (b) 100ng/ml of gDNA from different strains of Pf (Dd2, T9/94, HB3-B2) was transfected using lipofectamine into LPS-primed primary Aim2+/+ and _Aim2_−/− BMDMs. Cell culture supernatants were used to measure IL-1β using ELISA. Data are presented as mean ± SD of triplicates and are representative of 3 independent experiments. (c) Confocal microscopy of LPS primed ASC-CFP cells left untrasfected or transfected with 100ng/ml Syto60-labeled Pf gDNA. Scale bar: 20µm (top), 5µm (bottom) (d) Confocal microscopy of LPS primed AIM2-citrine macrophages left untransfected or transfected with 100ng/ml DAPI-labeled Pf gDNA, DAPI-labeled poly (dAdT) using lipofectamine or just incubated with sHz. Scale bar (from top to bottom): 15µm, 5µm, 15µm and 15µm. (e) Confocal microscopy of NLRP3-citrine macrophages untreated or treated with sHz/CpG (5µg/ml), sHz/Pf gDNA (4µg/ml), nigericin or transfected with 100ng/ml Pf gDNA using Lipofectamine. Images are representative of at least 10 fields of view and three independent experiments. Scale bar: All 20µm except the one in the bottom which is 5µm. See also Fig. S4.
Figure 5. nHz and sHz/Pf gDNA complex induce IL-1β production and pyroptosis both in vitro and in vivo via NLRP3 and AIM2
(a) Macrophages stably expressing ASC-CFP were left untreated or treated with nHz (100µM). The formation of ASC pyroptosomes was visualized using confocal microscopy. Scale bar: 15µm (left) and 5µm (right) (b) Primary wt, _Nlrp3_−/−, Aim2+/+, _Aim2_−/− and _Nlrp3_−/−, _Aim2_−/− BMDMs were incubated for 12 h with 15 µM and 30 µM of nHz, nigericin (10µM) or transfected with 1.5µg/ml poly (dAdT) using Lipofectamine. Cell culture supernatants were assessed for IL-1β release by ELISA (c) Primary wt, _Nlrp3_−/−, Aim2+/+, _Aim2_−/−, and _Nlrp3_−/−, _Aim2_−/− BMDMs were incubated for 12 h with 20 µM, 40 µM and 80 µM of nHz or transfected with Poly (dAdT). Cell survival was measured using calcein AM. Medium was set as 100%. Data are mean cytokine levels ± SD of triplicate determinations and are representative of 3 independent experiments (d) wt, _Nlrp3_−/−, Aim2+/+, _Aim2_−/− and _Nlrp3_−/−_Aim2_−/− mice were i.v. injected in the tail vein with endotoxin-free PBS or sHz/Pf gDNA (1mg sHz, 15µg Pf gDNA). After 12 h livers were dissected and homogenized. Each lane corresponds to one mouse. (e) wt (n=12), _Nlrp3_−/− (n=16), Aim2+/+(n=9), _Aim2_−/− (n=14), and _Nlrp3_−/− _Aim2_−/− (n=6) mice were intraperitonally injected with sHz/Pf gDNA (1mg sHz, 15µg Pf gDNA) or PBS. After 15 h, peritoneal cells were harvested, counted and FACS analysis was performed using GR-1 antibody. Basal neutrophil influx in PBS injected mice was subtracted to determine total number of neutrophils recruited to the peritoneal cavity. Student’s t-test was used to calculate P values (*p<0.05, **p<0.001). (f) Pf gDNA (5µg/ml) was DAPI stained for 30 min and used to make sHz/Pf gDNA. Lamp1-Kate2 macrophages were then stimulated with sHz/Pf gDNA for 2 h and subjected to reflection confocal microscopy. Fields are representative of at least 10 fields of view and three independent experiments. Scale bar: 5µm. See also Fig. S5.
Figure 6. _P. berghei_-RBCs induced IL-1β production is NLRP3 and AIM2 dependent
(a) Confocal imaging of immortalized BMDMs incubated with 8× 10⁵ P. berghei (NK65) Red star for 2 h. Lysosomes were stained with lysotracker (blue). Scale bar: 20µm (b) ELISA of the release of IL-1β from immortalized BMDMs pretreated with indicated concentrations of bafilomycin A for 2 h and then incubated with 8× 10⁵ _P. berghei_-RBCs for 12 h (c) ASC-CFP macrophages were incubated with 8× 10⁵ _P. berghei_-RBCs for 12 h and imaged by confocal microscopy. Natural Hz was visualized using reflection microscopy (green). Scale bar: 20µm (top) and 5µm (bottom) (d) _P. berghei_-RBCs (iRBCs) and uninfected (uRBCs) were incubated with DAPI for 1h and then co-cultured with AIM2-citrine macrophages for 2 h. Fields are representative of at least 10 fields of view and three independent experiments. Scale bar: 20µm (top), 20µm (middle) and 5µm (bottom) (e) Wt and _Tlr9_−/− BMDMs were incubated with 2.5×10⁵ and 5×10⁵ _P. berghei_-infected RBCs, 5×10⁵ uRBCs, or transfected with poly (dAdT) using Lipofectamine for 12 h. The supernatants were subjected to ELISA for IL-1β. *P<0.05, (Student’s _t_-test) (f) Primary wt, _NLRP3_−/−, AIM2+/+, _AIM2_−/− and _NLRP3_−/−, _AIM2_−/− BMDMs were incubated with 2.5×10⁵ and 5×10⁵ _P. berghei_-RBCs, 5×10⁵ uRBCs for 12 h or transfected with poly (dAdT) using Lipofectamine. The supernatants were subjected to ELISA for IL-1β. Infected RBCs used for all experiments above were taken at day 14 from C57BL/6 mice infected with P. berghei NK65. Data are presented as the mean of triplicate determinations ± SD and are representative of 3 independent experiments. See also Fig. S6.
Similar articles
- Malarial hemozoin activates the NLRP3 inflammasome through Lyn and Syk kinases.
Shio MT, Eisenbarth SC, Savaria M, Vinet AF, Bellemare MJ, Harder KW, Sutterwala FS, Bohle DS, Descoteaux A, Flavell RA, Olivier M. Shio MT, et al. PLoS Pathog. 2009 Aug;5(8):e1000559. doi: 10.1371/journal.ppat.1000559. Epub 2009 Aug 21. PLoS Pathog. 2009. PMID: 19696895 Free PMC article. - Both bone marrow-derived and non-bone marrow-derived cells contribute to AIM2 and NLRP3 inflammasome activation in a MyD88-dependent manner in dietary steatohepatitis.
Csak T, Pillai A, Ganz M, Lippai D, Petrasek J, Park JK, Kodys K, Dolganiuc A, Kurt-Jones EA, Szabo G. Csak T, et al. Liver Int. 2014 Oct;34(9):1402-13. doi: 10.1111/liv.12537. Epub 2014 Apr 17. Liver Int. 2014. PMID: 24650018 Free PMC article. - Involvement of the AIM2, NLRC4, and NLRP3 inflammasomes in caspase-1 activation by Listeria monocytogenes.
Wu J, Fernandes-Alnemri T, Alnemri ES. Wu J, et al. J Clin Immunol. 2010 Sep;30(5):693-702. doi: 10.1007/s10875-010-9425-2. Epub 2010 May 20. J Clin Immunol. 2010. PMID: 20490635 Free PMC article. - Regulation and Function of the Nucleotide Binding Domain Leucine-Rich Repeat-Containing Receptor, Pyrin Domain-Containing-3 Inflammasome in Lung Disease.
Lee S, Suh GY, Ryter SW, Choi AM. Lee S, et al. Am J Respir Cell Mol Biol. 2016 Feb;54(2):151-60. doi: 10.1165/rcmb.2015-0231TR. Am J Respir Cell Mol Biol. 2016. PMID: 26418144 Free PMC article. Review. - NLRP3 inflammasome: from a danger signal sensor to a regulatory node of oxidative stress and inflammatory diseases.
Abderrazak A, Syrovets T, Couchie D, El Hadri K, Friguet B, Simmet T, Rouis M. Abderrazak A, et al. Redox Biol. 2015;4:296-307. doi: 10.1016/j.redox.2015.01.008. Epub 2015 Jan 14. Redox Biol. 2015. PMID: 25625584 Free PMC article. Review.
Cited by
- Circadian Control of the Response of Macrophages to Plasmodium Spp.-Infected Red Blood Cells.
Carvalho Cabral P, Richard VR, Borchers CH, Olivier M, Cermakian N. Carvalho Cabral P, et al. Immunohorizons. 2024 Jun 1;8(6):442-456. doi: 10.4049/immunohorizons.2400021. Immunohorizons. 2024. PMID: 38916585 Free PMC article. - Role of NLRP3 inflammasome in central nervous system diseases.
Zhang L, Tang Y, Huang P, Luo S, She Z, Peng H, Chen Y, Luo J, Duan W, Xiong J, Liu L, Liu L. Zhang L, et al. Cell Biosci. 2024 Jun 7;14(1):75. doi: 10.1186/s13578-024-01256-y. Cell Biosci. 2024. PMID: 38849934 Free PMC article. Review. - Molecular regulation of NLRP3 inflammasome activation during parasitic infection.
Alonaizan R. Alonaizan R. Biosci Rep. 2024 May 29;44(5):BSR20231918. doi: 10.1042/BSR20231918. Biosci Rep. 2024. PMID: 38623843 Free PMC article. Review. - Itaconate impairs immune control of Plasmodium by enhancing mtDNA-mediated PD-L1 expression in monocyte-derived dendritic cells.
Ramalho T, Assis PA, Ojelabi O, Tan L, Carvalho B, Gardinassi L, Campos O, Lorenzi PL, Fitzgerald KA, Haynes C, Golenbock DT, Gazzinelli RT. Ramalho T, et al. Cell Metab. 2024 Mar 5;36(3):484-497.e6. doi: 10.1016/j.cmet.2024.01.008. Epub 2024 Feb 6. Cell Metab. 2024. PMID: 38325373 - Integrated NLRP3, AIM2, NLRC4, Pyrin inflammasome activation and assembly drive PANoptosis.
Oh S, Lee J, Oh J, Yu G, Ryu H, Kim D, Lee S. Oh S, et al. Cell Mol Immunol. 2023 Dec;20(12):1513-1526. doi: 10.1038/s41423-023-01107-9. Epub 2023 Nov 27. Cell Mol Immunol. 2023. PMID: 38008850
References
- Adachi K, Tsutsui H, Kashiwamura S, Seki E, Nakano H, Takeuchi O, Takeda K, Okumura K, Van Kaer L, Okamura H, et al. Plasmodium berghei infection in mice induces liver injury by an IL-12- and toll-like receptor/myeloid differentiation factor 88-dependent mechanism. J Immunol. 2001;167:5928–5934. - PubMed
- Ashong JO, Blench IP, Warhurst DC. The composition of haemozoin from Plasmodium falciparum. Trans R Soc Trop Med Hyg. 1989;83:167–172. - PubMed
- Barrera V, Skorokhod OA, Baci D, Gremo G, Arese P, Schwarzer E. Host fibrinogen stably bound to hemozoin rapidly activates monocytes via TLR-4 and CD11b/CD18-integrin: a new paradigm of hemozoin action. Blood. 2011;117:5674–5682. - PubMed
Publication types
MeSH terms
Substances
Grants and funding
- R01 AI079293/AI/NIAID NIH HHS/United States
- R01 AI083713/AI/NIAID NIH HHS/United States
- T32 AI095213/AI/NIAID NIH HHS/United States
- R37 AI067497/AI/NIAID NIH HHS/United States
- R01 AI067497/AI/NIAID NIH HHS/United States
- R21AI80907/AI/NIAID NIH HHS/United States
- R56 AI067497/AI/NIAID NIH HHS/United States
- AI067497/AI/NIAID NIH HHS/United States
- R01 AI093752/AI/NIAID NIH HHS/United States
- R21 AI080907/AI/NIAID NIH HHS/United States
- AI079293/AI/NIAID NIH HHS/United States
LinkOut - more resources
Full Text Sources
Other Literature Sources
Medical
Molecular Biology Databases
