Seasonal cycles in whole-body proximate composition and energy content of forage fish vary with water depth - PubMed (original) (raw)
Seasonal cycles in whole-body proximate composition and energy content of forage fish vary with water depth
Johanna J Vollenweider et al. Mar Biol. 2011.
Abstract
Quantifying the nutritional quality of forage fish is integral for understanding upper trophic levels as forage fish are the dominant prey for top predator fish, marine mammals, and sea birds. Many existing reports documenting body composition of forage species are not comparable due to confounding effects. This study systematically assessed the variability in proximate composition and energy content of 16 forage species in southeastern Alaska (57.2626 N/133.7394 W) between 2001 and 2004. Variation in energy and lipid contents was related to habitat, epipelagic planktivores varying most, mesopelagics intermediate, and demersal species relatively invariable. Season was the greatest source of variation as a result of short growing seasons at high latitude and energy allocation strategies for reproduction and growth. Among species that varied seasonally, energy and lipid increased over summer and declined during winter. Annual differences in body composition occurred during periods of peak energy content. Sampling recommendations and guidance for bioenergetics models are provided.
Figures
Fig. 1
Map of the two study sites in southeastern Alaska, Lynn Canal and Frederick Sound
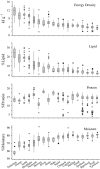
Fig. 2
Boxplots depicting the variation in the body composition of forage species pooled over all collections, including energy density (kJ g−1), % lipid, % protein, and % moisture
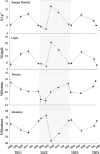
Fig. 3
Seasonal cycles in the body composition of Pacific herring (Clupea pallasi) (±SE) is presented as an example of the seasonal cycles observed in other forage fish
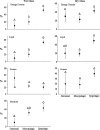
Fig. 4
Frequency of seasonal variation in body composition of forage species by depth group expressed as the percentage of comparisons of adjacent seasons that are statistically different (±SE). Like symbols indicate statistically similar groups determined by ANOVA (P < 0.05)
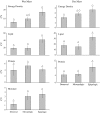
Fig. 5
Magnitude of seasonal variation in body composition of forage species depicted as the mean coefficient of variation (CV) of the annual means of body composition (energy density, lipid, protein, and moisture contents) by depth group (±SE). Like symbols indicate statistically similar groups determined by ANOVA (P < 0.05)
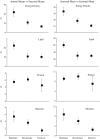
Fig. 6
Maximum discrepancies (±SE) in the body composition (energy density, lipid, protein, and moisture contents) between comparisons of (1) annual and seasonal mean body compositions, and (2) maximum and minimum seasonal mean body compositions. Species are grouped by depths they inhabit
Similar articles
- Lipid content and energy density of forage fishes from the northern Gulf of Alaska.
Anthony JA, Roby DD, Turco KR. Anthony JA, et al. J Exp Mar Biol Ecol. 2000 May 18;248(1):53-78. doi: 10.1016/s0022-0981(00)00159-3. J Exp Mar Biol Ecol. 2000. PMID: 10764884 - Heatwave-induced synchrony within forage fish portfolio disrupts energy flow to top pelagic predators.
Arimitsu ML, Piatt JF, Hatch S, Suryan RM, Batten S, Bishop MA, Campbell RW, Coletti H, Cushing D, Gorman K, Hopcroft RR, Kuletz KJ, Marsteller C, McKinstry C, McGowan D, Moran J, Pegau S, Schaefer A, Schoen S, Straley J, von Biela VR. Arimitsu ML, et al. Glob Chang Biol. 2021 May;27(9):1859-1878. doi: 10.1111/gcb.15556. Epub 2021 Mar 6. Glob Chang Biol. 2021. PMID: 33577102 Free PMC article. - Evidence for seasonal cycles in deep-sea fish abundances: A great migration in the deep SE Atlantic?
Milligan RJ, Scott EM, Jones DOB, Bett BJ, Jamieson AJ, O'Brien R, Pereira Costa S, Rowe GT, Ruhl HA, Smith KL Jr, de Susanne P, Vardaro MF, Bailey DM. Milligan RJ, et al. J Anim Ecol. 2020 Jul;89(7):1593-1603. doi: 10.1111/1365-2656.13215. Epub 2020 Apr 11. J Anim Ecol. 2020. PMID: 32198925 - To Everything There Is a Season: Summer-to-Winter Food Webs and the Functional Traits of Keystone Species.
Humphries MM, Studd EK, Menzies AK, Boutin S. Humphries MM, et al. Integr Comp Biol. 2017 Nov 1;57(5):961-976. doi: 10.1093/icb/icx119. Integr Comp Biol. 2017. PMID: 29040576 Review. - Seasonal changes in immune function.
Nelson RJ, Demas GE. Nelson RJ, et al. Q Rev Biol. 1996 Dec;71(4):511-48. doi: 10.1086/419555. Q Rev Biol. 1996. PMID: 8987173 Review.
Cited by
- A correlation between seasonally changing photoperiod, whole body lipid, and condition factor in juvenile spring Chinook salmon (Oncorhynchus tshawytscha).
Spangenberg DK, Fuhrman AE, Larsen DA, Beckman BR. Spangenberg DK, et al. PLoS One. 2023 May 18;18(5):e0285380. doi: 10.1371/journal.pone.0285380. eCollection 2023. PLoS One. 2023. PMID: 37200396 Free PMC article. - Review: the energetic value of zooplankton and nekton species of the Southern Ocean.
Schaafsma FL, Cherel Y, Flores H, van Franeker JA, Lea MA, Raymond B, van de Putte AP. Schaafsma FL, et al. Mar Biol. 2018;165(8):129. doi: 10.1007/s00227-018-3386-z. Epub 2018 Jul 18. Mar Biol. 2018. PMID: 30100628 Free PMC article. Review. - Genetically based population divergence in overwintering energy mobilization in brook charr (Salvelinus fontinalis).
Crespel A, Bernatchez L, Garant D, Audet C. Crespel A, et al. Genetica. 2013 Mar;141(1-3):51-64. doi: 10.1007/s10709-013-9705-x. Epub 2013 Feb 15. Genetica. 2013. PMID: 23412995 - Using energetic models to investigate the survival and reproduction of beaked whales (family Ziphiidae).
New LF, Moretti DJ, Hooker SK, Costa DP, Simmons SE. New LF, et al. PLoS One. 2013 Jul 17;8(7):e68725. doi: 10.1371/journal.pone.0068725. Print 2013. PLoS One. 2013. PMID: 23874737 Free PMC article. - Integrating isotopic and nutritional niches reveals multiple dimensions of individual diet specialisation in a marine apex predator.
Grainger R, Raoult V, Peddemors VM, Machovsky-Capuska GE, Gaston TF, Raubenheimer D. Grainger R, et al. J Anim Ecol. 2023 Feb;92(2):514-534. doi: 10.1111/1365-2656.13852. Epub 2022 Dec 23. J Anim Ecol. 2023. PMID: 36421071 Free PMC article.
References
- Bando MKH (2002) Comparing the nutritional quality of Steller sea lion (Eumetopias jubatus) diets. Master thesis, University of Alaska, Fairbanks, AK
- Bradford-Grieve JM, Probert PK, Nodder SD, Thompson D, Hall J, Hanchet S, Boyd P, Zeldis J, Baker AN, Best HA, Broekhuizen N, Childerhouse S, Clark M, Hadfield M, Safi K, Wilkinson I. Pilot trophic model for subantarctic water over the Southern Plateau, New Zealand: a low biomass, high transfer efficiency system. J Exp Mar Biol Ecol. 2003;289(2):223–262. doi: 10.1016/S0022-0981(03)00045-5. - DOI
- Brett JR. Chapter 1: energetics. In: Groot C, Margolis L, Clarke WC, editors. Physiological Ecology of Pacific Salmon. Vancouver: UBC Press; 1995.
- Carlson HR (1985) Seasonal distribution and environment of adult pacific herring (Clupea harengus pallasi) near Auke Bay, Lynn Canal, southeastern Alaska. Dissertation, Oregon State University, Corvallis, WA
LinkOut - more resources
Full Text Sources

