Global phylogenomic analysis disentangles the complex evolutionary history of DNA replication in archaea - PubMed (original) (raw)
Global phylogenomic analysis disentangles the complex evolutionary history of DNA replication in archaea
Kasie Raymann et al. Genome Biol Evol. 2014 Jan.
Abstract
The archaeal machinery responsible for DNA replication is largely homologous to that of eukaryotes and is clearly distinct from its bacterial counterpart. Moreover, it shows high diversity in the various archaeal lineages, including different sets of components, heterogeneous taxonomic distribution, and a large number of additional copies that are sometimes highly divergent. This has made the evolutionary history of this cellular system particularly challenging to dissect. Here, we have carried out an exhaustive identification of homologs of all major replication components in over 140 complete archaeal genomes. Phylogenomic analysis allowed assigning them to either a conserved and probably essential core of replication components that were mainly vertically inherited, or to a variable and highly divergent shell of extra copies that have likely arisen from integrative elements. This suggests that replication proteins are frequently exchanged between extrachromosomal elements and cellular genomes. Our study allowed clarifying the history that shaped this key cellular process (ancestral components, horizontal gene transfers, and gene losses), providing important evolutionary and functional information. Finally, our precise identification of core components permitted to show that the phylogenetic signal carried by DNA replication is highly consistent with that harbored by two other key informational machineries (translation and transcription), strengthening the existence of a robust organismal tree for the Archaea.
Keywords: Cdc6/Orc1; DNA gyrase; RPA/SSB; nanosized archaea; phylogeny; primase.
Figures
Fig. 1.—
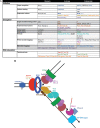
(A) General overview of the components of DNA replication in the Archaea compared to the other two domains of life. Same color in a given row indicates homology; gray shading indicates that the bacterial version has only structural similarity with the archaeal/eukaryal component; question marks represent components with unclear implication in archaeal replication, i.e., DnaG, Dna2, and RecJ homologs; asterisks indicate that a eukaryotic homolog exist but is not involved in replication, i.e., SSB and TopoVI. See main text for details. (B) Sketch of the DNA replication machinery in the Archaea. Colors corresponds to those in (A).
Fig. 2.—
Distribution of homologs of 22 main replication components in 142 archaeal genomes. Filled circles represent homologs that we assigned to the core replication machinery, whereas gray circles represent homologs assigned to the shell component (see text for details). Split genes are indicated by half circles, and the fused primases by a box (see text for details). Letters in first column indicate the phylum (A, Aigarchaeota; T, Thaumarchaeota; C, Crenarchaeota; K, Korarchaeota; N, Nanoarchaeota; E, Euryarchaeota). Asterisks indicate classes instead of orders. Full accession numbers are given in
supplementary table S1
,
Supplementary Material
online.
Fig. 3.—
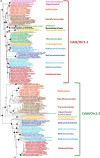
(A) Maximum likelihood phylogeny of Cdc6/Orc1 core components. The tree was calculated by Treefinder (MIX model + gamma4) based on 261 unambiguously aligned amino acid positions. The scale bar represents the average number of substitutions per site. Dots represent bootstrap values (BV) based on 100 replicates of the original alignment. For clarity, supports are shown for major lineages only: black dots indicate BV > 90%, gray dots BV 80–90%, and white dots BV <80%. (B) Evolutionary scenario for Cdc6/Orc1. The two Cdc6/Orc1 paralogs 1 (red) and 2 (green) arose from ancestral gene duplication in the Last Common Archaeal Ancestor. Independent gene losses occurred subsequently in a number of lineages, involving either one paralog (red crosses) or the other (green crosses), and in some cases both. See text for details.
Fig. 4.—
Homologs of DNA replication proteins found in archaeal plasmids and viruses. Colors correspond to those used in figure 1. Accession numbers are given in
supplementary table S2
,
Supplementary Material
online.
Fig. 5.—
Taxonomic distribution and diversity of archaeal SSB and RPA homologs plus the associated proteins (RAP2 and RAP3). ThermoDP, the proposed replacement for the native SSB of Thermoproteales, is shown in gray. See text for details.
Fig. 6.—
Schematic representation of the classic archaeal DNA primase genes encoding for the two subunits PriS and PriL, as opposed to the single genes encoding for fused archaeal primases that we found in some nanosized lineages. The presence of a PriS in Ca. Parvarchaeum acidophilum ARMAN-4 is unknown (question mark). The genome sizes are given in parentheses. See text for details.
Fig. 7.—
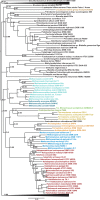
Bayesian phylogeny of a concatenation of archaeal DNA gyrase small and large subunits and a selection of bacterial homologs (1,083 amino acid positions). The tree was calculated by MrBayes (MIX model + gamma4). The scale bar represents the average number of substitutions per site. Supports at nodes indicate posterior probabilities. Colors correspond to archaeal orders according to those used in figure 2. The tree is collapsed for clarity. See
supplementary table S1
(
Supplementary Material
online) for accession numbers and taxonomic information.
Fig. 8.—
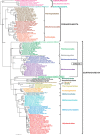
Bayesian phylogeny of a concatenated data set of 14 replication components (4,295 amino acid positions). The tree was calculated by Phylobayes (CAT + GTR + gamma4). The scale bar represents the average number of substitutions per site. Values at nodes represent posterior probabilities and BV based on 100 resamplings of the original data set calculated by PhyML (LG model + gamma4), when the same node was recovered.
Similar articles
- The CMG (CDC45/RecJ, MCM, GINS) complex is a conserved component of the DNA replication system in all archaea and eukaryotes.
Makarova KS, Koonin EV, Kelman Z. Makarova KS, et al. Biol Direct. 2012 Feb 13;7:7. doi: 10.1186/1745-6150-7-7. Biol Direct. 2012. PMID: 22329974 Free PMC article. - Archaeal phylogeny based on proteins of the transcription and translation machineries: tackling the Methanopyrus kandleri paradox.
Brochier C, Forterre P, Gribaldo S. Brochier C, et al. Genome Biol. 2004;5(3):R17. doi: 10.1186/gb-2004-5-3-r17. Epub 2004 Feb 26. Genome Biol. 2004. PMID: 15003120 Free PMC article. - An emerging phylogenetic core of Archaea: phylogenies of transcription and translation machineries converge following addition of new genome sequences.
Brochier C, Forterre P, Gribaldo S. Brochier C, et al. BMC Evol Biol. 2005 Jun 2;5:36. doi: 10.1186/1471-2148-5-36. BMC Evol Biol. 2005. PMID: 15932645 Free PMC article. - Archaeal DNA replication and repair.
Kelman Z, White MF. Kelman Z, et al. Curr Opin Microbiol. 2005 Dec;8(6):669-76. doi: 10.1016/j.mib.2005.10.001. Epub 2005 Oct 20. Curr Opin Microbiol. 2005. PMID: 16242991 Review. - Archaeal DNA Replication.
Greci MD, Bell SD. Greci MD, et al. Annu Rev Microbiol. 2020 Sep 8;74:65-80. doi: 10.1146/annurev-micro-020518-115443. Epub 2020 Jun 5. Annu Rev Microbiol. 2020. PMID: 32503372 Free PMC article. Review.
Cited by
- Association between the dynamics of multiple replication origins and the evolution of multireplicon genome architecture in haloarchaea.
Wu Z, Yang H, Liu J, Wang L, Xiang H. Wu Z, et al. Genome Biol Evol. 2014 Oct 3;6(10):2799-810. doi: 10.1093/gbe/evu219. Genome Biol Evol. 2014. PMID: 25281843 Free PMC article. - Diversity of DNA Replication in the Archaea.
Ausiannikava D, Allers T. Ausiannikava D, et al. Genes (Basel). 2017 Jan 31;8(2):56. doi: 10.3390/genes8020056. Genes (Basel). 2017. PMID: 28146124 Free PMC article. Review. - DNA-binding mechanism and evolution of replication protein A.
Madru C, Martínez-Carranza M, Laurent S, Alberti AC, Chevreuil M, Raynal B, Haouz A, Le Meur RA, Delarue M, Henneke G, Flament D, Krupovic M, Legrand P, Sauguet L. Madru C, et al. Nat Commun. 2023 Apr 22;14(1):2326. doi: 10.1038/s41467-023-38048-w. Nat Commun. 2023. PMID: 37087464 Free PMC article. - Rooting the domain archaea by phylogenomic analysis supports the foundation of the new kingdom Proteoarchaeota.
Petitjean C, Deschamps P, López-García P, Moreira D. Petitjean C, et al. Genome Biol Evol. 2014 Dec 19;7(1):191-204. doi: 10.1093/gbe/evu274. Genome Biol Evol. 2014. PMID: 25527841 Free PMC article. - Comparative genomics highlights the unique biology of Methanomassiliicoccales, a Thermoplasmatales-related seventh order of methanogenic archaea that encodes pyrrolysine.
Borrel G, Parisot N, Harris HM, Peyretaillade E, Gaci N, Tottey W, Bardot O, Raymann K, Gribaldo S, Peyret P, O'Toole PW, Brugère JF. Borrel G, et al. BMC Genomics. 2014 Aug 13;15:679. doi: 10.1186/1471-2164-15-679. BMC Genomics. 2014. PMID: 25124552 Free PMC article.
References
- Aves SJ, Liu Y, Richards TA. Evolutionary diversification of eukaryotic DNA replication machinery. Subcell Biochem. 2012;62:19–35. - PubMed
- Baker BJ, et al. Lineages of Acidophilic Archaea Revealed by Community Genomic Analysis. Science. 2006;314:1933–1935. - PubMed
Publication types
MeSH terms
Substances
LinkOut - more resources
Full Text Sources
Other Literature Sources


