Conflicting phylogenies for early land plants are caused by composition biases among synonymous substitutions - PubMed (original) (raw)
Conflicting phylogenies for early land plants are caused by composition biases among synonymous substitutions
Cymon J Cox et al. Syst Biol. 2014 Mar.
No abstract available
Figures
Figure 1.
Summary trees of conflict between chloroplast protein-coding gene data (a) and their translated proteins (b) of the data set Karol10-nuc. Trees are depicted without the outgroup taxa (Chlorokybus and Mesosigma) and the seed plant clade is collapsed—full trees are presented in the Supplementary Material. Taxa are indicated as follows: algal charophytes (blue), bryophytes (_Marchantia_—liverwort, Physcomitrella and _Tortula_—mosses, _Anthoceros_—hornwort; green), lycopods (mauve), and ferns (orange). a) Bayesian MCMC (p4) with model 3*(GTR + I + Γ4 + CV2) + Rm + PP, marginal likelihood -Lh = 452713.8554 (Supplementary Fig. S1); b) Bayesian MCMC (p4) with model gcpREV + I + Γ4 + PP, marginal likelihood -Lh = 178265.1502 (Supplementary Fig. S9). The branch leading to Selaginalla species has been arbitrarily shortened (original length = 0.261519). All protein analyses maximally supported a monophyletic bryophytes (hornworts, mosses, liverworts) but only weak (<0.95 PP) support for relationships among tracheophyte groups (lycopods, ferns, seed plants) was observed.
Figure 2.
Correspondence analysis of the first and second principal components of the variation of RSCU among the taxa in the Karol10-nuc chloroplast gene data set. Algae: blue; bryophytes: green; ferns: orange; lycopods: mauve; seed plants: red.
Figure 3.
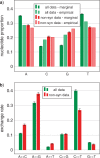
Comparison of mean model parameter values compared between data of all substitutions (all) and the codon-degenerated data consisting of only nonsynonymous substitutions (non-syn) of the Karol10-nuc data: a) composition frequencies, both empirical values and marginal estimates, and b) marginal estimates of substitution exchange rates. Marginal estimates are mean posterior values from the homogeneous MCMC analyses shown in Supplementary Figures S6 and S15 for “all” and “non-syn” data respectively. The error bars represent the 95% confidence interval (1.96 standard deviations of the mean of the posterior sample).
Figure 4.
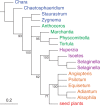
Summary tree of the maximum-likelihood bootstrap analysis of the codon-degenerated Karol10-nuc data. Tree structure summation and taxon colors follow those detailed in the legend of Figure 1.
Similar articles
- Mitochondrial phylogenomics of early land plants: mitigating the effects of saturation, compositional heterogeneity, and codon-usage bias.
Liu Y, Cox CJ, Wang W, Goffinet B. Liu Y, et al. Syst Biol. 2014 Nov;63(6):862-78. doi: 10.1093/sysbio/syu049. Epub 2014 Jul 28. Syst Biol. 2014. PMID: 25070972 - Origin of land plants using the multispecies coalescent model.
Zhong B, Liu L, Yan Z, Penny D. Zhong B, et al. Trends Plant Sci. 2013 Sep;18(9):492-5. doi: 10.1016/j.tplants.2013.04.009. Epub 2013 May 24. Trends Plant Sci. 2013. PMID: 23707196 Review. - Codon usage bias and determining forces in green plant mitochondrial genomes.
Wang B, Yuan J, Liu J, Jin L, Chen JQ. Wang B, et al. J Integr Plant Biol. 2011 Apr;53(4):324-34. doi: 10.1111/j.1744-7909.2011.01033.x. Epub 2011 Mar 21. J Integr Plant Biol. 2011. PMID: 21332641 - Complex mutation and weak selection together determined the codon usage bias in bryophyte mitochondrial genomes.
Wang B, Liu J, Jin L, Feng XY, Chen JQ. Wang B, et al. J Integr Plant Biol. 2010 Dec;52(12):1100-8. doi: 10.1111/j.1744-7909.2010.00998.x. Epub 2010 Oct 22. J Integr Plant Biol. 2010. PMID: 21106008 - The evolution of land plant cilia.
Hodges ME, Wickstead B, Gull K, Langdale JA. Hodges ME, et al. New Phytol. 2012 Aug;195(3):526-540. doi: 10.1111/j.1469-8137.2012.04197.x. Epub 2012 Jun 12. New Phytol. 2012. PMID: 22691130 Review.
Cited by
- Crown Group Lejeuneaceae and Pleurocarpous Mosses in Early Eocene (Ypresian) Indian Amber.
Heinrichs J, Scheben A, Bechteler J, Lee GE, Schäfer-Verwimp A, Hedenäs L, Singh H, Pócs T, Nascimbene PC, Peralta DF, Renner M, Schmidt AR. Heinrichs J, et al. PLoS One. 2016 May 31;11(5):e0156301. doi: 10.1371/journal.pone.0156301. eCollection 2016. PLoS One. 2016. PMID: 27244582 Free PMC article. - Hornwort stomata do not respond actively to exogenous and environmental cues.
Pressel S, Renzaglia KS, Dicky Clymo RS, Duckett JG. Pressel S, et al. Ann Bot. 2018 Jun 28;122(1):45-57. doi: 10.1093/aob/mcy045. Ann Bot. 2018. PMID: 29897395 Free PMC article. - Organellar phylogenomics of an emerging model system: Sphagnum (peatmoss).
Jonathan Shaw A, Devos N, Liu Y, Cox CJ, Goffinet B, Flatberg KI, Shaw B. Jonathan Shaw A, et al. Ann Bot. 2016 Aug;118(2):185-96. doi: 10.1093/aob/mcw086. Epub 2016 Jun 6. Ann Bot. 2016. PMID: 27268484 Free PMC article. - Plastid phylogenomics and cytonuclear discordance in Rubioideae, Rubiaceae.
Thureborn O, Wikström N, Razafimandimbison SG, Rydin C. Thureborn O, et al. PLoS One. 2024 May 20;19(5):e0302365. doi: 10.1371/journal.pone.0302365. eCollection 2024. PLoS One. 2024. PMID: 38768140 Free PMC article. - Nonreciprocal complementation of KNOX gene function in land plants.
Frangedakis E, Saint-Marcoux D, Moody LA, Rabbinowitsch E, Langdale JA. Frangedakis E, et al. New Phytol. 2017 Oct;216(2):591-604. doi: 10.1111/nph.14318. Epub 2016 Nov 25. New Phytol. 2017. PMID: 27886385 Free PMC article.
References
- Bowman J.L. Walkabout on the long branches of plant evolution. Curr. Opin. Plant Biol. 2013;16:70–77. - PubMed
- Bowman J.L., Floyd S.K., Sakakibara K. Green genes - comparative genomics of the green branch of life. Cell. 2007;129:229–234. - PubMed
- Chang Y., Graham S.W. Inferring the higher-order phylogeny of mosses (Bryophyta) and relatives using a large, multigene plastid data set. Am. J. Botany. 2011;98:839–849. - PubMed
Publication types
MeSH terms
Substances
LinkOut - more resources
Full Text Sources
Other Literature Sources


