Clathrin terminal domain-ligand interactions regulate sorting of mannose 6-phosphate receptors mediated by AP-1 and GGA adaptors - PubMed (original) (raw)
Clathrin terminal domain-ligand interactions regulate sorting of mannose 6-phosphate receptors mediated by AP-1 and GGA adaptors
Wiebke Stahlschmidt et al. J Biol Chem. 2014.
Abstract
Clathrin plays important roles in intracellular membrane traffic including endocytosis of plasma membrane proteins and receptors and protein sorting between the trans-Golgi network (TGN) and endosomes. Whether clathrin serves additional roles in receptor recycling, degradative sorting, or constitutive secretion has remained somewhat controversial. Here we have used acute pharmacological perturbation of clathrin terminal domain (TD) function to dissect the role of clathrin in intracellular membrane traffic. We report that internalization of major histocompatibility complex I (MHCI) is inhibited in cells depleted of clathrin or its major clathrin adaptor complex 2 (AP-2), a phenotype mimicked by application of Pitstop® inhibitors of clathrin TD function. Hence, MHCI endocytosis occurs via a clathrin/AP-2-dependent pathway. Acute perturbation of clathrin also impairs the dynamics of intracellular clathrin/adaptor complex 1 (AP-1)- or GGA (Golgi-localized, γ-ear-containing, Arf-binding protein)-coated structures at the TGN/endosomal interface, resulting in the peripheral dispersion of mannose 6-phosphate receptors. By contrast, secretory traffic of vesicular stomatitis virus G protein, recycling of internalized transferrin from endosomes, or degradation of EGF receptor proceeds unperturbed in cells with impaired clathrin TD function. These data indicate that clathrin is required for the function of AP-1- and GGA-coated carriers at the TGN but may be dispensable for outward traffic en route to the plasma membrane.
Keywords: Cell Biology; Endosomes; Lysosomes; Membrane Trafficking; Molecular Cell Biology; Protein Sorting.
Figures
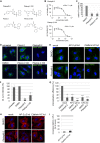
FIGURE 1.
MHCI endocytosis depends on clathrin and AP-2. A, chemical structures of Pitstop-2, Pitstop 2–100, Pitnot-2, and Pitnot-2-100. B, IC50 values of Pitstop-2- or Pitstop-2-100-mediated interference with clathrin TD complex formation determined by ELISA. C, internalization of transferrin-Alexa 488 into HeLa cells is inhibited by Pitstop-2 or Pitstop-2-100 (30 μ
m
). The amount of transferrin-Alexa 488 internalized into DMSO-treated cells was set to 100%. D, MHCI internalization into HeLa cells is inhibited by Pitstop-2 or the related compound Pitstop-2-100 (30 μ
m
) but not by two different non-clathrin-binding control compounds. Scale bar, 10 μm. E, representative images of MHCI internalization into CHC- or AP-2(μ)-depleted HeLa cells. Cells were treated with either DMSO or Pitstop-2. Scale bar, 10 μm. F, quantification of data shown in D (n = 3 independent experiments). The amount of MHCI internalized into DMSO-treated cells was set to 100%. G, quantification of MHCI internalization into clathrin (CHC k.d.)- or AP-2(μ)-depleted (μ2 k.d.) cells treated with DMSO or Pitstop-2 as shown in E. The amount of MHCI internalized into DMSO-treated control cells was set to 100% (n = 3 independent experiments; *, p < 0.05; **, p < 0.005; ***, p < 0.0005). H, representative images of MHCI surface levels of CHC- or AP-2(μ)-depleted HeLa cells. Cells were treated with either DMSO or Pitstop-2. Scale bar, 10 μm. I, quantification of clathrin (CHC) or AP-2(α) levels in cells treated with siRNA against AP-2(μ) or CHC or mock transfected (n = 3 independent experiments).
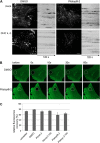
FIGURE 2.
Pitstop-2-mediated inhibition of CCP dynamics has no major effects on general plasma membrane mobility. A, time lapse series of cells stably expressing AP-2(σ2)-eGFP were collected after clathrin HC depletion or mock treatment using live cell TIRF microscopy. Cells were imaged for 2 min at 37 °C in presence of 30 μ
m
Pitstop-2 or DMSO (0.1%). AP-2(σ2)-eGFP distribution is unaffected by clathrin HC knockdown (CHC k.d.) or application of Pitstop-2, respectively. Kymographs depict stalled AP-2(σ2)-eGFP dynamics in absence of clathrin HC or after Pitstop-2-mediated inhibition of clathrin TD. Scale bar, 10 μm. B, FRAP analysis of HeLa expressing GPI-eGFP and either left untreated or treated with 0.1% DMSO or with 30 μ
m
of the indicated compounds (Pitstop-2, Pitstop-2-100, Pitnot-2, or Pitnot-2-100; see Fig. 1_A_). 60 s after bleaching, Pitstop-2-treated cells show similar recovery to DMSO-treated controls. Scale bar, 10 μm. C, quantitative analysis of fluorescence recovery as shown in B. Graphs represent the relative fluorescence recovery normalized to the fluorescent intensity before bleaching (n = 3 independent experiments; *, p < 0.05).
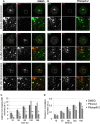
FIGURE 3.
Acute inhibition of clathrin TD function impairs exchange of clathrin pools at the TGN/endosomal interface. A and B, UV excitation of clathrin LC-Kaede causes photoconversion from green to red in the illuminated TGN area. 180 s of postphotoconversion mixing of the red and green clathrin LC populations is observed in DMSO-treated control cells (A, arrowheads), but not in cells treated with 30 μ
m
Pitstop-2 (B). Scale bar, 10 μm. C, quantification of data displayed in A and B (n = 3 independent experiments; t = 0 min set to zero). Recovery of green fluorescence in the TGN is impaired in Pitstop-2-treated cells. D, reduced co-localization of the red and green populations of clathrin LC-Kaede in cells treated with Pitstop-2 compared with cells incubated with DMSO or control compound. Depicted are Pearson's correlation coefficients at different time points postphotoconversion subtracted by the value at 0 min (n = 3 independent experiments; *, p < 0.05; **, p < 0.005).
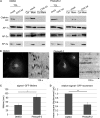
FIGURE 4.
Unperturbed membrane recruitment but impaired dynamics of AP-1 coats upon acute inhibition of clathrin TD function. A, immunoblots of total cell lysates (TCL) and cytosolic (Cyt) and membrane (Mem) fractions of HeLa cells. Note the equal membrane recruitment of APs in cells depleted of endogenous CHC compared with control cells (mock). The presence of Pitstop-2 had no additional effect on protein distribution (n = 3 independent experiments). B, live cell confocal imaging of BSC-1 cells stably expressing AP-1 eGFP-σ1. Application of 30 μ
m
Pitstop-2 reduces AP-1 dynamics compared with DMSO-treated controls. Scale bar, 10 μm. Displayed are inverted kymographs that represent the complete time lapse series (2 min) obtained by confocal imaging at 2 Hz. C and D, mean lifetimes (C) and relative mobility (D) of AP-1 (σ1)-GFP positive structures (n = 3 independent experiments; *, p < 0.05; **, p < 0.005).
FIGURE 5.
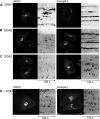
Clathrin TD function regulates GGA but not COPI dynamics. Live cell confocal imaging of HeLa cells expressing GGA1-eGFP (A), GGA2-eGFP (B), GGA3-eGFP (C), or ϵ-COP-eGFP (D). Time lapse series were collected for 2 min at 37 °C in the presence of 30 μ
m
Pitstop-2 or DMSO (0.1%). Application of Pitstop-2 has no effect on the cellular distribution of GGA1-eGFP (A), GGA2-eGFP (B), or GGA3-eGFP (C) but stalls their dynamics. COPI-eGFP localization and dynamics are unaffected by Pitstop-2 treatment. D, kymographs represent the complete time lapse series (2 min) acquired at 2 Hz (n = 3 independent experiments). Scale bar, 10 μm.
FIGURE 6.
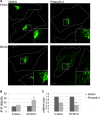
Acute inhibition of clathrin TD function causes MPR dispersion. A, live cell confocal imaging of HeLa cells stably expressing eGFP-CI-MPR. Application of Pitstop-2 causes GFP-CI-MPR dispersion to endosomes. Scale bar, 10 μm. B and C, quantification of the data shown in A. Inhibition of clathrin by Pitstop-2 causes a significant increase in the total number (B) and relative size (C) of eGFP-CI-MPR-containing objects. For C, the data were normalized to DMSO-treated control cells (set to 1) (n = 3 independent experiments; **, p < 0.005).
FIGURE 7.
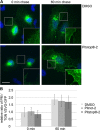
VSVG-SP-GFP secretion proceeds unaffected in the presence of Pitstop-2. A, after 60 min of incubation at 19 °C, VSVG-SP-GFP accumulates in the Golgi. 60 min of chase of VSVG-SP-GFP at 32 °C leads to secretion to the plasma membrane. No obvious differences of fluorescence distribution can be detected in cells treated with DMSO or Pitstop-2. Scale bar, 10 μm. Fluorescence intensities in the blow ups were enhanced for better visualization of VSVG-SP-GFP at the plasma membrane. B, quantification of the data shown in A. Secretion of VSVG-SP-GFP from the TGN to the plasma membrane proceeds unperturbed in cells treated with Pitstop-2 compared with cells treated with DMSO or inactive Pitnot-2 control compound (n = 3 independent experiments).
FIGURE 8.
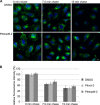
Transferrin recycling proceeds unperturbed in the presence of Pitstop-2. A, HeLa cells loaded for 30 min with Alexa 488-labeled transferrin (transferrin488) were treated with DMSO or 30 μ
m
Pitstop-2 and allowed to recycle transferrin488 for the indicated times. Scale bar, 10 μm. B, quantification of the data shown in A (n = 3 independent experiments). The data were normalized to the amount of transferrin488 present in DMSO-treated cells at 0 min of chase.
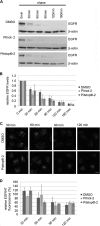
FIGURE 9.
EGF receptor degradation proceeds unperturbed in the presence of Pitstop-2. A, 30 μ
m
Pitstop-2, 30 μ
m
Pitnot-2, or 0.1% DMSO were added to HeLa cells 30 min after stimulation with 500 ng/ml unlabeled EGF and chased for the indicated times. Pitstop-2 treatment had no effect on EGF receptor degradation. B, quantification of data shown in A using ImageJ (n = 3 independent experiments). C, HeLa cells loaded for 20 min with Alexa647-labeled EGF (EGF647) were treated with DMSO or 30 μ
m
Pitstop®-2 and allowed to degrade EGF647 for the indicated times. Scale bar, 10 μm. D, quantification of the data shown in C (n = 2 independent experiments). The data were normalized to the amount of EGF647 present in DMSO-treated cells at 0 min of chase.
Similar articles
- Clathrin adaptor epsinR is required for retrograde sorting on early endosomal membranes.
Saint-Pol A, Yélamos B, Amessou M, Mills IG, Dugast M, Tenza D, Schu P, Antony C, McMahon HT, Lamaze C, Johannes L. Saint-Pol A, et al. Dev Cell. 2004 Apr;6(4):525-38. doi: 10.1016/s1534-5807(04)00100-5. Dev Cell. 2004. PMID: 15068792 - Traffic Through the Trans-Golgi Network and the Endosomal System Requires Collaboration Between Exomer and Clathrin Adaptors in Fission Yeast.
Hoya M, Yanguas F, Moro S, Prescianotto-Baschong C, Doncel C, de León N, Curto MÁ, Spang A, Valdivieso MH. Hoya M, et al. Genetics. 2017 Feb;205(2):673-690. doi: 10.1534/genetics.116.193458. Epub 2016 Dec 14. Genetics. 2017. PMID: 27974503 Free PMC article. - Phosphoinositide-mediated clathrin adaptor progression at the trans-Golgi network.
Daboussi L, Costaguta G, Payne GS. Daboussi L, et al. Nat Cell Biol. 2012 Feb 19;14(3):239-48. doi: 10.1038/ncb2427. Nat Cell Biol. 2012. PMID: 22344030 Free PMC article. - New directions for the clathrin adaptor AP-1 in cell biology and human disease.
Duncan MC. Duncan MC. Curr Opin Cell Biol. 2022 Jun;76:102079. doi: 10.1016/j.ceb.2022.102079. Epub 2022 Apr 13. Curr Opin Cell Biol. 2022. PMID: 35429729 Free PMC article. Review. - Visualization of TGN-endosome trafficking in mammalian and Drosophila cells.
Kametaka S, Waguri S. Kametaka S, et al. Methods Enzymol. 2012;504:255-71. doi: 10.1016/B978-0-12-391857-4.00013-6. Methods Enzymol. 2012. PMID: 22264539 Review.
Cited by
- Wbox2: A clathrin terminal domain-derived peptide inhibitor of clathrin-mediated endocytosis.
Chen Z, Mino RE, Mettlen M, Michaely P, Bhave M, Reed DK, Schmid SL. Chen Z, et al. J Cell Biol. 2020 Sep 7;219(9):e201908189. doi: 10.1083/jcb.201908189. J Cell Biol. 2020. PMID: 32520988 Free PMC article. - Role of Clathrin and Dynamin in Clathrin Mediated Endocytosis/Synaptic Vesicle Recycling and Implications in Neurological Diseases.
Prichard KL, O'Brien NS, Murcia SR, Baker JR, McCluskey A. Prichard KL, et al. Front Cell Neurosci. 2022 Jan 18;15:754110. doi: 10.3389/fncel.2021.754110. eCollection 2021. Front Cell Neurosci. 2022. PMID: 35115907 Free PMC article. Review. - The Noonan Syndrome Gene Lztr1 Controls Cardiovascular Function by Regulating Vesicular Trafficking.
Sewduth RN, Pandolfi S, Steklov M, Sheryazdanova A, Zhao P, Criem N, Baietti MF, Lechat B, Quarck R, Impens F, Sablina AA. Sewduth RN, et al. Circ Res. 2020 May 8;126(10):1379-1393. doi: 10.1161/CIRCRESAHA.119.315730. Epub 2020 Mar 16. Circ Res. 2020. PMID: 32175818 Free PMC article. - Non-specificity of Pitstop 2 in clathrin-mediated endocytosis.
Willox AK, Sahraoui YM, Royle SJ. Willox AK, et al. Biol Open. 2014 Apr 4;3(5):326-31. doi: 10.1242/bio.20147955. Biol Open. 2014. PMID: 24705016 Free PMC article. - Tumor-associated calreticulin variants functionally compromise the peptide loading complex and impair its recruitment of MHC-I.
Arshad N, Cresswell P. Arshad N, et al. J Biol Chem. 2018 Jun 22;293(25):9555-9569. doi: 10.1074/jbc.RA118.002836. Epub 2018 May 16. J Biol Chem. 2018. PMID: 29769311 Free PMC article.
References
- Brodsky F. M. (2012) Diversity of clathrin function. New tricks for an old protein. Annu. Rev. Cell Dev. Biol. 28, 309–336 - PubMed
- McMahon H. T., Boucrot E. (2011) Molecular mechanism and physiological functions of clathrin-mediated endocytosis. Nat. Rev. Mol. Cell Biol. 12, 517–533 - PubMed
- Wieffer M., Maritzen T., Haucke V. (2009) SnapShot. Endocytic trafficking. Cell 137, 382.e1–e3 - PubMed
Publication types
MeSH terms
Substances
LinkOut - more resources
Full Text Sources
Other Literature Sources
Research Materials
Miscellaneous
