Probing the subcellular localization of hopanoid lipids in bacteria using NanoSIMS - PubMed (original) (raw)
Probing the subcellular localization of hopanoid lipids in bacteria using NanoSIMS
David M Doughty et al. PLoS One. 2014.
Abstract
The organization of lipids within biological membranes is poorly understood. Some studies have suggested lipids group into microdomains within cells, but the evidence remains controversial due to non-native imaging techniques. A recently developed NanoSIMS technique indicated that sphingolipids group into microdomains within membranes of human fibroblast cells. We extended this NanoSIMS approach to study the localization of hopanoid lipids in bacterial cells by developing a stable isotope labeling method to directly detect subcellular localization of specific lipids in bacteria with ca. 60 nm resolution. Because of the relatively small size of bacterial cells and the relative abundance of hopanoid lipids in membranes, we employed a primary (2)H-label to maximize our limit of detection. This approach permitted the analysis of multiple stable isotope labels within the same sample, enabling visualization of subcellular lipid microdomains within different cell types using a secondary label to mark the growing end of the cell. Using this technique, we demonstrate subcellular localization of hopanoid lipids within alpha-proteobacterial and cyanobacterial cells. Further, we provide evidence of hopanoid lipid domains in between cells of the filamentous cyanobacterium Nostoc punctiforme. More broadly, our method provides a means to image lipid microdomains in a wide range of cell types and test hypotheses for their functions in membranes.
Conflict of interest statement
Competing Interests: The authors have declared that no competing interests exist.
Figures
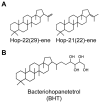
Figure 1. Chemical structures of hopanoid lipids used in this study.
Structures of the two hopene isomers (A) and bacteriohopanetetrol (B) that were isotopically labeled with 2H, purified, and imaged in this study.
Figure 2. Cell biology of R. palustris.
(A) Cell cycle of the budding mode of cell division displayed by R. palustris in which motile swarmer cells (S) lose their flagellum and develop into tubed mother cells (M) that give rise to new swarmer cells. (B–E) A pulse of 13C labeled acetate added 30 min prior to the fixation of the cells allows for the visualization of the _R. palu_stris cell cycle. Quantitative raster ion images of 12C− (B) and 13C− (C) were used to calculate the δ13C image (D) that indicates the presence of 13C enrichment at one pole of the cells as indicated by the white arrow. (E) A bacterial flagellum is visible, indicated by the red arrow, within an early raster frame in the 12C− ion image confirming that the 13C is preferentially associated with the growing bud. Scale bars are 2 µm. Images shown are representative of 3 fields of view and 3 independent biological experiments.
Figure 3. Detection of exogenously added 2H-labeled BHT in R. palustris.
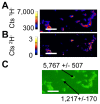
NanoSIMS images showing the count rates of 1H− (A) and 2H− (B) ions. Note that the 2H abundance is patchy within cells. (C) A non-quantitative overlay showing 2H− on top of 12C− counts to mark cells. δ2H values for regions of interest encompassing two different cells marked by arrows. Cells were defined by contiguous regions generating a 12C− count rate greater than 300 cts s−1 (shown as bright in the green image) and had a bulk δ2H of 638±10, indicating the broad incorporation of labeled hopanoids. The reported error reflects the standard error of total ion counts within each of the indicated cells. Images shown are representative of 20 fields of view and 3 independent biological experiments. All scale bars are 5 µm.
Figure 4. Depth profiles of R. palustris cells using NanoSIMS.
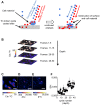
(A) Conceptual illustration of NanoSIMS analysis of a cell. As the beam is rastered over the surface of the sample in many cycles, more material is removed from the sample surface and thus time (i.e. cycle number) relates to depth. (B) A stack of ion images binned by cycle number shows how cells are degraded over time by the ion beam. Quantitative images of 12C− (C), 2H− frames 5 to 10 (D), and 2H− frames 30–35 (E) are shown to illustrate changes that occur in the 2H−-labeling patterns as the primary beam burns through the cells. (F) A depth profile of the cell indicated by the white arrow in panel C provides a quantitative example of a cell initially appearing unlabeled but becoming positive for the label as the opposite side of the cell is sampled. All scale bars are 2 µm. Error bars reflect the standard error of the total number of ions. Images shown are representative of 5 fields of view and 3 independent biological experiments.
Figure 5. Analysis of BHT localization in N. punctiforme cells.
NanoSIMS images of 1H− (A) and 2H− (B) ion count rate and a non-quantitative overlay (C) of the raster images depicting their relative localizations with 1H− ions shown in green and 2H− ions shown in red. The thin white circles in C denote the regions of interest (numbered 1–8) selected for the pooled analysis of data in panel D. The white arrow indicates that region of interest 4 is within region of interest 2. (D) Plot depicting the δ13C and δ2H values for the regions of interest (numbered blue circles) and all image pixels containing greater than 100 cts s−1 1H− ions, which encompasses all biomass in the image (blue square). Additional regions of interest points shown as are data taken from other ion images (unnumbered blue circles). The line is an ordinary least squares regression of interest shown in C. (E) A white dashed line indicates the region enlarged in panel F. (F) The white dashed line indicates a region of interest along a filament for the isotopic profile shown in G. (G) δ2H values along the filament highlight a periodicity with labeled BHT concentrated at the junctions between cells. All scale bars are 5 µm. Error bars in (G) reflect the standard error of the total number of ions. Images shown are representative of 5 fields of view and 3 independent biological experiments.
Figure 6. Analysis of hopene localization in N. punctiforme cells.
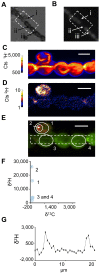
(A) Phase contrast and (B) fluorescence images indicating the presence of a jettisoned akinete envelope (i), a heterocyst (ii), and vegetative cells (iii). NanoSIMS images of 1H− (C) and 2H− (D) ion count rates and a non-quantitative overlay of the two ions depicting their relative localizations (E) with 1H− ions shown in green and 2H− ions shown in red. Note the substantial concentrations of labeled BHT within the akinete envelope. (F) δ13C and δ2H values for the regions of interest denoted by solid white lines in E (numbered blue circles) and all image pixels containing greater than 100 1H− ions (blue square). The dashed white lines in E depict the region selected for the isotopic profile shown in (G). A plot of δ2H values along the filament indicates the BHT label is localized near cell junctions. All scale bars are 5 µm. Error bars reflect the standard error of the total number of ions in the selected region. Images are representative of 5 fields of view and 3 independent biological experiments.
Similar articles
- Toward Understanding the Subcellular Distributions of Cholesterol and Sphingolipids Using High-Resolution NanoSIMS Imaging.
Brunet MA, Kraft ML. Brunet MA, et al. Acc Chem Res. 2023 Apr 4;56(7):752-762. doi: 10.1021/acs.accounts.2c00760. Epub 2023 Mar 13. Acc Chem Res. 2023. PMID: 36913670 - Hopanoid lipids: from membranes to plant-bacteria interactions.
Belin BJ, Busset N, Giraud E, Molinaro A, Silipo A, Newman DK. Belin BJ, et al. Nat Rev Microbiol. 2018 May;16(5):304-315. doi: 10.1038/nrmicro.2017.173. Epub 2018 Feb 19. Nat Rev Microbiol. 2018. PMID: 29456243 Free PMC article. Review. - Transcriptome analysis of hopanoid deficient mutant of Rhodopseuodomonas palustris TIE-1.
Lodha TD, B I, Ch S, Ch V R. Lodha TD, et al. Microbiol Res. 2019 Jan;218:108-117. doi: 10.1016/j.micres.2018.10.009. Epub 2018 Oct 29. Microbiol Res. 2019. PMID: 30454652 - Hopanoid-producing bacteria in the Red Sea include the major marine nitrite oxidizers.
Kharbush JJ, Thompson LR, Haroon MF, Knight R, Aluwihare LI. Kharbush JJ, et al. FEMS Microbiol Ecol. 2018 Jun 1;94(6). doi: 10.1093/femsec/fiy063. FEMS Microbiol Ecol. 2018. PMID: 29668882 - Tracking activity and function of microorganisms by stable isotope probing of membrane lipids.
Wegener G, Kellermann MY, Elvert M. Wegener G, et al. Curr Opin Biotechnol. 2016 Oct;41:43-52. doi: 10.1016/j.copbio.2016.04.022. Epub 2016 May 12. Curr Opin Biotechnol. 2016. PMID: 27179643 Review.
Cited by
- Exploring the existence of lipid rafts in bacteria.
Bramkamp M, Lopez D. Bramkamp M, et al. Microbiol Mol Biol Rev. 2015 Mar;79(1):81-100. doi: 10.1128/MMBR.00036-14. Microbiol Mol Biol Rev. 2015. PMID: 25652542 Free PMC article. - Heavy water and (15) N labelling with NanoSIMS analysis reveals growth rate-dependent metabolic heterogeneity in chemostats.
Kopf SH, McGlynn SE, Green-Saxena A, Guan Y, Newman DK, Orphan VJ. Kopf SH, et al. Environ Microbiol. 2015 Jul;17(7):2542-56. doi: 10.1111/1462-2920.12752. Epub 2015 Mar 27. Environ Microbiol. 2015. PMID: 25655651 Free PMC article. - Impact of Fatty-Acid Labeling of Bacillus subtilis Membranes on the Cellular Lipidome and Proteome.
Nickels JD, Poudel S, Chatterjee S, Farmer A, Cordner D, Campagna SR, Giannone RJ, Hettich RL, Myles DAA, Standaert RF, Katsaras J, Elkins JG. Nickels JD, et al. Front Microbiol. 2020 May 15;11:914. doi: 10.3389/fmicb.2020.00914. eCollection 2020. Front Microbiol. 2020. PMID: 32499768 Free PMC article. - Lack of Methylated Hopanoids Renders the Cyanobacterium Nostoc punctiforme Sensitive to Osmotic and pH Stress.
Garby TJ, Matys ED, Ongley SE, Salih A, Larkum AWD, Walter MR, Summons RE, Neilan BA. Garby TJ, et al. Appl Environ Microbiol. 2017 Jun 16;83(13):e00777-17. doi: 10.1128/AEM.00777-17. Print 2017 Jul 1. Appl Environ Microbiol. 2017. PMID: 28455341 Free PMC article. - Methylation at the C-2 position of hopanoids increases rigidity in native bacterial membranes.
Wu CH, Bialecka-Fornal M, Newman DK. Wu CH, et al. Elife. 2015 Jan 19;4:e05663. doi: 10.7554/eLife.05663. Elife. 2015. PMID: 25599566 Free PMC article.
References
- Owens DM, Magenau A, Williamson D & Gaus K (2012) The lipid raft hypothesis revisited–new insights on raft composition and function from super-resolution fluorescence microscopy. Bioessays 34: 739–747. - PubMed
- Suzuki KG (2004) Lipid rafts generate digital-like signal transduction in cell plasma membranes. Biotechnol J 7: 753–761. - PubMed
- Chen JC, Viollier PH, Shapiro L (2004) A membrane metalloprotease participates in the sequential degradation of a Caulobacter polarity determinant. Mol Micro 55: 1085–1103. - PubMed
Publication types
MeSH terms
Substances
LinkOut - more resources
Full Text Sources
Other Literature Sources


