Efficient endoderm induction from human pluripotent stem cells by logically directing signals controlling lineage bifurcations - PubMed (original) (raw)
. 2014 Feb 6;14(2):237-52.
doi: 10.1016/j.stem.2013.12.007. Epub 2014 Jan 9.
Lay Teng Ang 2, Jingyao Zhang 3, Vibhor Kumar 3, Jasmin Ang 3, Jun Qiang Auyeong 3, Kian Leong Lee 4, Siew Hua Choo 3, Christina Y Y Lim 3, Massimo Nichane 3, Junru Tan 3, Monireh Soroush Noghabi 3, Lisa Azzola 5, Elizabeth S Ng 6, Jens Durruthy-Durruthy 7, Vittorio Sebastiano 7, Lorenz Poellinger 4, Andrew G Elefanty 6, Edouard G Stanley 6, Qingfeng Chen 8, Shyam Prabhakar 3, Irving L Weissman 7, Bing Lim 9
Affiliations
- PMID: 24412311
- PMCID: PMC4045507
- DOI: 10.1016/j.stem.2013.12.007
Efficient endoderm induction from human pluripotent stem cells by logically directing signals controlling lineage bifurcations
Kyle M Loh et al. Cell Stem Cell. 2014.
Abstract
Human pluripotent stem cell (hPSC) differentiation typically yields heterogeneous populations. Knowledge of signals controlling embryonic lineage bifurcations could efficiently yield desired cell types through exclusion of alternate fates. Therefore, we revisited signals driving induction and anterior-posterior patterning of definitive endoderm to generate a coherent roadmap for endoderm differentiation. With striking temporal dynamics, BMP and Wnt initially specified anterior primitive streak (progenitor to endoderm), yet, 24 hr later, suppressed endoderm and induced mesoderm. At lineage bifurcations, cross-repressive signals separated mutually exclusive fates; TGF-β and BMP/MAPK respectively induced pancreas versus liver from endoderm by suppressing the alternate lineage. We systematically blockaded alternate fates throughout multiple consecutive bifurcations, thereby efficiently differentiating multiple hPSC lines exclusively into endoderm and its derivatives. Comprehensive transcriptional and chromatin mapping of highly pure endodermal populations revealed that endodermal enhancers existed in a surprising diversity of "pre-enhancer" states before activation, reflecting the establishment of a permissive chromatin landscape as a prelude to differentiation.
Copyright © 2014 Elsevier Inc. All rights reserved.
Figures
Figure 1. Dynamic signaling switch for primitive streak and endoderm formation
A) Microarray analysis of genes upregulated >2-fold during AFBLy treatment of H9 hESC (Touboul et al., 2010) and GO analysis B) To test effects of increasing FGF2 (10-40 ng/mL), Wnt3a (15-100 ng/mL), CHIR99021 (50-1000 nM) or BMP4 (3-20 ng/mL) (panels i, ii, iii and iv, respectively) and respective inhibitors (100 nM PD173074, 2 μM IWP2, 150 ng/mL Dkk1 and 250 nM DM3189) on PS formation, H1 hESC were differentiated towards PS for 24 hours with indicated base combinations of
A
ctivin (100 ng/mL),
F
GF2 (20 ng/mL) and 10 μM
LY
294002 (“
AFLy
” or “
ALy
”) in conjunction with the indicated signaling perturbations, and qPCR was performed (day 1) C) To test effects of increasing BMP, FGF or Wnt signaling (10 ng/mL BMP4, 3 μM CHIR and 5-20 ng/mL FGF2; panels i, ii and iii respectively) on DE vs. mesoderm emergence from PS, H1 hESC were initially differentiated with AFBLy towards PS for 24 hours and then subsequently differentiated with AFLy, AFBLy or
ALy
+ 250 nM DM3189 (“
ADLy
”) for 48 subsequent hours with indicated signaling perturbations, and qPCR was performed (day 3) D) HES3 MIXL1-GFP+ PS (Davis et al., 2008) induced by 100 ng/mL
A
ctivin, 2 μM
C
HIR and 50 nM PI-103 (
ACP
) by day 1 of differentiation was blocked by concomitant addition of BMP inhibitors (300 ng/mL noggin or 250 nM DM3189) (i); truth table (ii) and schematic (iii) of dynamic signaling during differentiation See also Fig. S1
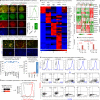
Figure 2. Efficient definitive endoderm induction in defined conditions by SR1
A) H1 hESC differentiated by ACP for 24 hours stained for BRACHYURY, FOXA2, EOMES and LHX1 (nuclear staining by DAPI), scale bar=100 μm for all subsequent figures (left); FACS shows >99% of HES3 hESC are MIXL1-GFP+ (Davis et al., 2008) after 24 hours of ACP treatment (right) B) Microarray heatmap of independent triplicates; undifferentiated HES3 hESC (Day 0), ACP-induced APS (Day 1), SR1-induced DE (Day 3) or hESC differentiated by AFBLy (Touboul et al., 2010) or serum (D'Amour et al., 2005) for 3 days C) FOXA2 and SOX17 staining of SR1-, serum- or AFBLy-treated H1 hESC after 3 days of differentiation (top); summary of CXCR4+PDGFRα− DE percentages in hPSC (grey) or after SR1 differentiation (blue) from 7 hPSC lines, dots depict experimental replicates (bottom left); histogram summarizing CXCR4+PDGFRα− DE percentages after various differentiation protocols, error bars depict standard deviation (bottom right) D) FACS analysis of H9 SOX17-mCHERRY hESC; reporter expression before or after 2 days of SR1 differentiation E) FACS analysis of CXCR4 and PDGFRα expression before or after SR1 differentiation from indicated hPSC lines F) Single-cell qPCR heatmap of 80 single cells (H7 hESC, or those differentiated by SR1, AFBLy or serum for 2 days) G) To test their neural competence, H1 hESC after 0-2 days of SR1 induction were transferred (“→”) into neuralizing media (“N”, 3 days) and neural gene expression was compared to SR1-induced DE (“day 3 DE”), see Supplementary Experimental Procedures See also Fig. S2, S3
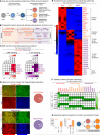
Figure 3. Anteroposterior patterning of hESC-derived definitive endoderm
A) Overview of anteroposterior patterning strategy B) TF expression in anteroposteriorly patterned endoderm in vivo, see Table S1 C) To test effects of (i) increasing BMP4 (10-25 ng/mL) or (ii) increasing CHIR (3-6 μM) on MHG induction, day 3 DE was differentiated for 4 subsequent days with indicated base conditions together with designated signaling perturbations until day 7, with AFG and PFG controls indicated (subsumed by Fig. S4a); (i) FGF+CHIR = 100 ng/mL FGF2 + 3 μM CHIR; (ii) BF = 10 ng/mL BMP4 + 100 ng/mL FGF2 D) OTX2, FOXA2 and CDX2 staining of H1-derived day 7 AFG and MHG respectively with quantification E) Microarray heatmap of HES3-derived AFG, PFG, and MHG populations on day 7 in independent triplicate F) qPCR of day 7 AFG, PFG, and MHG populations from H7 and HES3 hESC lines; HOX genes boxed G) To test their pancreatic or hepatic competence, day 3 DE was patterned into AFG or PFG for 1-2 days, and each was then subsequently differentiated towards pancreas or liver for 3 further days, see Supplementary Experimental Procedures See also Fig. S4
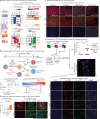
Figure 4. Bifurcation of liver versus pancreas from posterior foregut
A) To test effects of increasing amounts of (i-iii) BMP/TGFβ signaling or (iv) FGF/MAPK signaling on pancreas vs. liver induction, day 3 DE was differentiated with indicated conditions with (i-ii) 5-20 ng/mL Activin or (ii-iii) 5-10 ng/mL BMP4 and respective inhibitors (1 μM A8301, 250 nM DM3189, 100 nM PD173074, 500 nM PD0325901) where indicated. Abbreviations for base conditions: (i) RS = 2 μM RA + SANT1; (ii-iii) RS+PD = RS + PD0325901; (iv) DRK = DM3189 + RA + KAAD-Cyclopamine B) Depictions of (i) dynamic signaling inputs, (ii) truth table and (iii) dichotomy of BMP and TGFβ signaling for liver versus pancreas induction C) AFP immunostaining of day 7 early liver progenitors and quantification D) Substrate luciferase assay for CYP3A4 metabolic activity (i) and staining for LDLR expression and LDL-DyLight 594 uptake (ii) in hESC-derived late hepatic progeny E) CAG-GFP+ hESC differentiated into early hepatic progenitors or late hepatic progeny were transplanted (Chen et al., 2013) (top left); human albumin levels in mouse sera, each dot is an individual mouse (fractions of successfully engrafted mice indicated; top right); recipient whole-liver cross-section with different lobes and subfields indicated, scale bar=5mm (middle right); costaining for human albumin and GFP in four distinct hepatic lobes, fields numbered above (bottom) See also Fig. S4, S5
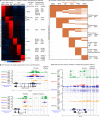
Figure 5. Comprehensively mapping transcriptional and epigenetic dynamics during endodermal development
A) RNA-seq heatmap of stage-specific genes upregulated at indicated lineage transitions (Supplementary Experimental Procedures) B, D) Compiled ChIP-seq (histone modifications), RNA-seq (gene expression), vertebrate conservation (Phastcons) and coding gene structure at selected genomic loci with cell types and genomic distance indicated. Numbers indicate fold enrichment over input (ChIP-seq) and FPKM values (RNA-seq). C) Binary heatmap of H3K27ac-marked active enhancers activated at respective differentiation phases (Supplementary Experimental Procedures), each row is an individual enhancer See also Fig. S5-S7
Figure 6. TGFβ signaling inaugurates endodermal active enhancers
A) Top-ranked GO terms associated with DE-specific active enhancers by GREAT (McLean et al., 2010) without pre-selection B) Boxplot of RNA-seq FPKM expression values of genes adjacent to DE-specific enhancers at indicated in vitro differentiation stages C) Phastcons score of DE-specific active DE enhancers D) Top-ranked GO terms associated with DE enhancers identified from a previous dataset (Gifford et al., 2013) using identical analytic methods (Table S6) E) TF motifs overrepresented in DE-specific active enhancers (Table S5b) F) Left: ChIP-seq signal heatmap based on all distal EOMES, SMAD2/3/4 and FOXH1 peaks in DE, showing TF overlap with one another and K27ac; each row is a single distal element (6 kB window size). Right: Average H3K27ac tag count at DE distal elements bound by all 1, 2, 3 or 4 DE TFs (EOMES, SMAD2/3, SMAD4 & FOXH1) G) EOMES, FOXH1 and SMAD2/3/4 colocalize at conserved SOX17 enhancer (MTL: multiple TF locus) See also Fig. S6
Figure 7. A constellation of diverse “pre-enhancer” states
A) ChIP-seq signal heatmap of indicated chromatin marks across future DE enhancer regions in hESC, organized by unbiased clustering; each row is a single pre-enhancer B) Frequency of DE pre-enhancers overlapping with a given chromatin mark in hESC C) Occupancy of DE enhancers by endoderm TFs in DE cells that were originally either H2AZ-only pre-enhancers (class 1) or latent pre-enhancers (class 5) in hESC D) Pre-enhancer state summary See also Fig. S6
Similar articles
- Defining early lineage specification of human embryonic stem cells by the orchestrated balance of canonical Wnt/beta-catenin, Activin/Nodal and BMP signaling.
Sumi T, Tsuneyoshi N, Nakatsuji N, Suemori H. Sumi T, et al. Development. 2008 Sep;135(17):2969-79. doi: 10.1242/dev.021121. Epub 2008 Jul 30. Development. 2008. PMID: 18667462 - The generation of definitive endoderm from human embryonic stem cells is initially independent from activin A but requires canonical Wnt-signaling.
Naujok O, Diekmann U, Lenzen S. Naujok O, et al. Stem Cell Rev Rep. 2014 Aug;10(4):480-93. doi: 10.1007/s12015-014-9509-0. Stem Cell Rev Rep. 2014. PMID: 24913278 - In vitro modelling of anterior primitive streak patterning with human pluripotent stem cells identifies the path to notochord progenitors.
Robles-Garcia M, Thimonier C, Angoura K, Ozga E, MacPherson H, Blin G. Robles-Garcia M, et al. Development. 2024 Dec 15;151(24):dev202983. doi: 10.1242/dev.202983. Epub 2024 Dec 12. Development. 2024. PMID: 39611739 Free PMC article. - Pioneer factors, genetic competence, and inductive signaling: programming liver and pancreas progenitors from the endoderm.
Zaret KS, Watts J, Xu J, Wandzioch E, Smale ST, Sekiya T. Zaret KS, et al. Cold Spring Harb Symp Quant Biol. 2008;73:119-26. doi: 10.1101/sqb.2008.73.040. Epub 2008 Nov 21. Cold Spring Harb Symp Quant Biol. 2008. PMID: 19028990 Free PMC article. Review. - Signaling pathways during maintenance and definitive endoderm differentiation of embryonic stem cells.
Sui L, Bouwens L, Mfopou JK. Sui L, et al. Int J Dev Biol. 2013;57(1):1-12. doi: 10.1387/ijdb.120115ls. Int J Dev Biol. 2013. PMID: 23585347 Review.
Cited by
- Stable iPSC-derived NKX2-1+ lung bud tip progenitor organoids give rise to airway and alveolar cell types.
Hein RFC, Conchola AS, Fine AS, Xiao Z, Frum T, Brastrom LK, Akinwale MA, Childs CJ, Tsai YH, Holloway EM, Huang S, Mahoney J, Heemskerk I, Spence JR. Hein RFC, et al. Development. 2022 Oct 15;149(20):dev200693. doi: 10.1242/dev.200693. Epub 2022 Aug 30. Development. 2022. PMID: 36039869 Free PMC article. - Pluripotent Stem Cell-derived Strategies to Treat Acute Liver Failure: Current Status and Future Directions.
Liu J, Yuan Z, Wang Q. Liu J, et al. J Clin Transl Hepatol. 2022 Aug 28;10(4):692-699. doi: 10.14218/JCTH.2021.00353. Epub 2022 Mar 9. J Clin Transl Hepatol. 2022. PMID: 36062278 Free PMC article. Review. - lncRNA DIGIT and BRD3 protein form phase-separated condensates to regulate endoderm differentiation.
Daneshvar K, Ardehali MB, Klein IA, Hsieh FK, Kratkiewicz AJ, Mahpour A, Cancelliere SOL, Zhou C, Cook BM, Li W, Pondick JV, Gupta SK, Moran SP, Young RA, Kingston RE, Mullen AC. Daneshvar K, et al. Nat Cell Biol. 2020 Oct;22(10):1211-1222. doi: 10.1038/s41556-020-0572-2. Epub 2020 Sep 7. Nat Cell Biol. 2020. PMID: 32895492 Free PMC article. - Step-Wise Chondrogenesis of Human Induced Pluripotent Stem Cells and Purification Via a Reporter Allele Generated by CRISPR-Cas9 Genome Editing.
Adkar SS, Wu CL, Willard VP, Dicks A, Ettyreddy A, Steward N, Bhutani N, Gersbach CA, Guilak F. Adkar SS, et al. Stem Cells. 2019 Jan;37(1):65-76. doi: 10.1002/stem.2931. Epub 2018 Oct 31. Stem Cells. 2019. PMID: 30378731 Free PMC article. - Protocol for germ lineage differentiation of primed human pluripotent stem cells using chemically defined, nutrient-balanced media.
Lu V, Doan MT, Roy IJ, Torres A Jr, Teitell MA. Lu V, et al. STAR Protoc. 2022 Jul 19;3(3):101568. doi: 10.1016/j.xpro.2022.101568. eCollection 2022 Sep 16. STAR Protoc. 2022. PMID: 35880122 Free PMC article.
References
- Beppu H, Kawabata M, Hamamoto T, Chytil A, Minowa O, Noda T, Miyazono K. BMP type II receptor is required for gastrulation and early development of mouse embryos. Dev Biol. 2000;221:249–258. - PubMed
- Bernardo AS, Faial T, Gardner L, Niakan KK, Ortmann D, Senner CE, Callery EM, Trotter MW, Hemberger M, Smith JC, et al. BRACHYURY and CDX2 mediate BMP-induced differentiation of human and mouse pluripotent stem cells into embryonic and extraembryonic lineages. Cell Stem Cell. 2011;9:144–155. - PMC - PubMed
- Candia AF, Watabe T, Hawley SH, Onichtchouk D, Zhang Y, Derynck R, Niehrs C, Cho KW. Cellular interpretation of multiple TGF-β signals: intracellular antagonism between activin/BVg1 and BMP-2/4 signaling mediated by Smads. Development. 1997;124:4467–4480. - PubMed
Publication types
MeSH terms
Substances
LinkOut - more resources
Full Text Sources
Other Literature Sources
Molecular Biology Databases


