Tuning of antigen sensitivity by T cell receptor-dependent negative feedback controls T cell effector function in inflamed tissues - PubMed (original) (raw)
Tuning of antigen sensitivity by T cell receptor-dependent negative feedback controls T cell effector function in inflamed tissues
Tetsuya Honda et al. Immunity. 2014.
Abstract
Activated T cells must mediate effector responses sufficiently to clear pathogens while avoiding excessive tissue damage. Here we have combined dynamic intravital microscopy with ex vivo assessments of T cell cytokine responses to generate a detailed spatiotemporal picture of CD4(+) T cell effector regulation in the skin. In response to antigen, effector T cells arrested transiently on antigen-presenting cells, briefly producing cytokine and then resuming migration. Antigen recognition led to upregulation of the programmed death-1 (PD-1) glycoprotein by T cells and blocking its canonical ligand, programmed death-ligand 1 (PD-L1), lengthened the duration of migration arrest and cytokine production, showing that PD-1 interaction with PD-L1 is a major negative feedback regulator of antigen responsiveness. We speculate that the immune system employs T cell recruitment, transient activation, and rapid desensitization to allow the T cell response to rapidly adjust to changes in antigen presentation and minimize collateral injury to the host.
Copyright © 2014 Elsevier Inc. All rights reserved.
Figures
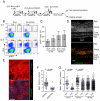
Figure 1. Characterization of antigen-dependent and independent effector T cell behavior in inflamed skin
(A) Schematic illustration of DTH induction. (B) Representative histograms and (C) quantification of CD4+eGFP+ OT-II T cells from inflamed skin. Ear skin was collected at the indicated time point and cell composition was analyzed by flow cytometry after tissue disruption. Graph shows the percent of CD4+ cells that are eGFP+; mean +/− SD from at least three mice per group. (D) Immunofluorescence staining of an inflamed ear section containing OT-II eGFP+ cells during a DTH response. 48 hrs after KLH challenge, ear skin was fixed, sectioned, and stained with DAPI to identify nuclei and an anti-MHC-II Ab. Epidermis (Epi), dermis (Derm), and cartilage (Cart) regions of the ear are indicated. Note, the side of the ear receiving an intradermal injection of antigen shows the most inflammation and dermal swelling. (E) Representative picture of OT-II T cells in epidermis (upper panel) and dermis (lower panel). See also Movie S1. (F) Comparison of OT-II T cell mean velocity in dermis and epidermis. Each symbol represents an individual cell. Horizontal lines indicate median value of the population. (G) Quantification of mean velocity for dermal OT-II T cells in the presence and absence of cognate antigen. Each symbol represents an individual cell. Horizontal lines indicate median value of the population. P values, unpaired Student’s t-test. See also Movie S2. All data are representative of three or more independent experiments. Scale bars: 50μm
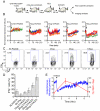
Figure 2. Synchronized activation of effector T cells reveals inverse correlation between effector function and motility
(A) Schematic illustration of modified DTH system. (B) Antigen-induced OT-II T cell arrest in response to different doses of OVA323 peptide. Each line represents the average normalized instantaneous velocity over time from an individual animal treated at a given peptide dose. The velocity before OVA323 peptide administration is normalized to one. Data are compiled from multiple experiments. See also Movie S3. (C) Representative flow cytometry histograms and (D) quantification of IFN-γ production from OT-II T cells 2 hrs after administration of different doses of OVA323 peptide. Graph shows the percent OTII-T cells that are IFN-γ+; mean +/− SEM from at least 3 mice per group. (E) OT-II T cell instantaneous velocity over time and the percent OT-II T cells that are IFN-γ+ before and after administration of 100μg of OVA323. See also Movie S4. All data are representative of three or more independent experiments.
Figure 3. Antigen presentation persists after the regain of T cell motility
(A) Schematic illustration of experimental protocol. (B) Representative image from an intravital data set (left panel). Image was taken 12 hrs after administration of 100μg of OVA323. In vitro primed OT-II T cells and p25 T cells were labeled with CMTMR (red) and Cell Tracker blue (blue), respectively, and transferred 3 hrs before image acquisition. Right panel shows the paths of T cell migration over the duration of the movie. See also Movie S5. (C and D) Quantification of mean velocity for endogenously primed OT-II T cells and in vitro generated OT-II T cells and p25 T cells. Horizontal lines indicate median value of the population. Data are representative of two independent experiments. Scale bars: 50μm
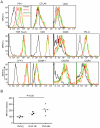
Figure 4. Expression of surface molecules on OT-II T cells after OVA323 administration
(A) Representative histogram of various surface molecules on OT-II T cells from at least three independent experiments. DTH ear skin was collected and digested at the indicated time point after administration of 100μg of OVA323 and cells were surface stained with the indicated antibodies. Intracellular staining was performed for CTLA4. (B) The median fluorescence intensity (MFI) of PD-1 staining was quantified before and after peptide administration. All values were normalized to the average MFI of the OVA(-) group, set as 100. P values, unpaired Student’s t-test.
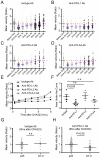
Figure 5. Effect of blocking antibodies on the recovery of T cell motility after OVA323 administration
(A-D) Representative time course of mean velocity for OT-II T cells before and after administration of 100μg of OVA323 in the presence of the indicated antibodies. The median value of the population before OVA323 administration was set as one, and each dot indicates an individual cell. Blue horizontal lines indicate the ratio of mean velocity to initial velocity at the indicated time point, and red dashed lines indicate initial velocity. Data are generated from 30 minute data sets beginning at each indicated time point. (E) Summary of the time course of T cell motility change from data in (A-D). Each symbol indicates the ratio of the mean velocity as in (A-D). (F) Quantification of motility recovery for OT-II T cells in the presence of different blocking antibodies. Area under the curve in (E) was measured. Each symbol indicates area under the curve for an individual independent experiment. (G, H) Comparison of mean velocity between in vivo primed p25 T cells and OT-II T cells 8 hrs after OVA 323 stimulation either with isotype antibody treatment (G) or anti-PD-L1 antibody (H). See also Movies S6. Data are representative of three or more independent experiments. P values, unpaired Student’s t-test. n.s.- not significant.
Figure 6. PD-L1 blockade prolongs effector function of OT-II T cells after antigen-induced arrest
(A) Representative contour plots and (B) quantification for IFN-γ production from OT-II T cells in the presence and absence of anti-PD-L1 antibody. DTH was induced in primed mice and the animals treated with isotype control or anti-PD-L1 blocking antibody prior to administration of 100μg OVA323. Skin cells were collected 3 hrs (B) or 8 hrs (A and C) after OVA323 administration and intracellular staining for IFN-γ was performed. Each symbol in (B and C) indicates the result from an individual mouse. Data are representative of three or more independent experiments. P values, unpaired Student’s t-test. n.s.- not significant.
Comment in
- T cell responses: kiss and run.
Kugelberg E. Kugelberg E. Nat Rev Immunol. 2014 Mar;14(3):134. doi: 10.1038/nri3628. Epub 2014 Feb 14. Nat Rev Immunol. 2014. PMID: 24525838 No abstract available. - How T cells lose their touch.
Dustin ML. Dustin ML. Immunity. 2014 Feb 20;40(2):169-71. doi: 10.1016/j.immuni.2014.02.001. Immunity. 2014. PMID: 24560192 Free PMC article.
Similar articles
- Pathogen-related differences in the abundance of presented antigen are reflected in CD4+ T cell dynamic behavior and effector function in the lung.
Torabi-Parizi P, Vrisekoop N, Kastenmuller W, Gerner MY, Egen JG, Germain RN. Torabi-Parizi P, et al. J Immunol. 2014 Feb 15;192(4):1651-1660. doi: 10.4049/jimmunol.1301743. Epub 2014 Jan 15. J Immunol. 2014. PMID: 24431231 Free PMC article. - Programmed death-1 (PD-1):PD-ligand 1 interactions inhibit TCR-mediated positive selection of thymocytes.
Keir ME, Latchman YE, Freeman GJ, Sharpe AH. Keir ME, et al. J Immunol. 2005 Dec 1;175(11):7372-9. doi: 10.4049/jimmunol.175.11.7372. J Immunol. 2005. PMID: 16301644 Free PMC article. - Peritumoral administration of DRibbles-pulsed antigen-presenting cells enhances the antitumor efficacy of anti-GITR and anti-PD-1 antibodies via an antigen presenting independent mechanism.
Patel JM, Cui Z, Wen ZF, Dinh CT, Hu HM. Patel JM, et al. J Immunother Cancer. 2019 Nov 20;7(1):311. doi: 10.1186/s40425-019-0786-7. J Immunother Cancer. 2019. PMID: 31747946 Free PMC article. - Role of non-classical T cells in skin immunity.
Park JS, Kim JH. Park JS, et al. Mol Immunol. 2018 Nov;103:286-292. doi: 10.1016/j.molimm.2018.09.024. Epub 2018 Oct 18. Mol Immunol. 2018. PMID: 30343117 Review. - New approaches to dissect degeneracy and specificity in T cell antigen recognition.
Jacobsen M, Cepok S, Oertel WH, Sommer N, Hemmer B. Jacobsen M, et al. J Mol Med (Berl). 2001 Jul;79(7):358-67. doi: 10.1007/s001090100230. J Mol Med (Berl). 2001. PMID: 11466557 Review.
Cited by
- The Impact of Malaria Parasites on Dendritic Cell-T Cell Interaction.
Osii RS, Otto TD, Garside P, Ndungu FM, Brewer JM. Osii RS, et al. Front Immunol. 2020 Jul 24;11:1597. doi: 10.3389/fimmu.2020.01597. eCollection 2020. Front Immunol. 2020. PMID: 32793231 Free PMC article. Review. - T follicular helper cells in space-time.
Qi H. Qi H. Nat Rev Immunol. 2016 Oct;16(10):612-25. doi: 10.1038/nri.2016.94. Epub 2016 Aug 30. Nat Rev Immunol. 2016. PMID: 27573485 Review. - Cytomegalovirus Infection Leads to Development of High Frequencies of Cytotoxic Virus-Specific CD4+ T Cells Targeted to Vascular Endothelium.
Pachnio A, Ciaurriz M, Begum J, Lal N, Zuo J, Beggs A, Moss P. Pachnio A, et al. PLoS Pathog. 2016 Sep 8;12(9):e1005832. doi: 10.1371/journal.ppat.1005832. eCollection 2016 Sep. PLoS Pathog. 2016. PMID: 27606804 Free PMC article. - TLR or NOD receptor signaling skews monocyte fate decision via distinct mechanisms driven by mTOR and miR-155.
Coillard A, Guyonnet L, De Juan A, Cros A, Segura E. Coillard A, et al. Proc Natl Acad Sci U S A. 2021 Oct 26;118(43):e2109225118. doi: 10.1073/pnas.2109225118. Proc Natl Acad Sci U S A. 2021. PMID: 34686603 Free PMC article. - TCR ligand potency differentially impacts PD-1 inhibitory effects on diverse signaling pathways.
Chan W, Cao YM, Zhao X, Schrom EC, Jia D, Song J, Sibener LV, Dong S, Fernandes RA, Bradfield CJ, Smelkinson M, Kabat J, Hor JL, Altan-Bonnet G, Garcia KC, Germain RN. Chan W, et al. J Exp Med. 2023 Dec 4;220(12):e20231242. doi: 10.1084/jem.20231242. Epub 2023 Oct 5. J Exp Med. 2023. PMID: 37796477 Free PMC article.
References
- Barnden MJ, Allison J, Heath WR, Carbone FR. Defective TCR expression in transgenic mice constructed using cDNA-based alpha- and beta-chain genes under the control of heterologous regulatory elements. Immunol Cell Biol. 1998;76:34–40. - PubMed
- Bartholomaus I, Kawakami N, Odoardi F, Schlager C, Miljkovic D, Ellwart JW, Klinkert WE, Flugel-Koch C, Issekutz TB, Wekerle H, Flugel A. Effector T cell interactions with meningeal vascular structures in nascent autoimmune CNS lesions. Nature. 2009;462:94–98. - PubMed
Publication types
MeSH terms
Substances
LinkOut - more resources
Full Text Sources
Other Literature Sources
Molecular Biology Databases
Research Materials


