Mistimed sleep disrupts circadian regulation of the human transcriptome - PubMed (original) (raw)
. 2014 Feb 11;111(6):E682-91.
doi: 10.1073/pnas.1316335111. Epub 2014 Jan 21.
Emma E Laing, Carla S Möller-Levet, Daan R van der Veen, Giselda Bucca, Alpar S Lazar, Nayantara Santhi, Ana Slak, Renata Kabiljo, Malcolm von Schantz, Colin P Smith, Derk-Jan Dijk
Affiliations
- PMID: 24449876
- PMCID: PMC3926083
- DOI: 10.1073/pnas.1316335111
Mistimed sleep disrupts circadian regulation of the human transcriptome
Simon N Archer et al. Proc Natl Acad Sci U S A. 2014.
Abstract
Circadian organization of the mammalian transcriptome is achieved by rhythmic recruitment of key modifiers of chromatin structure and transcriptional and translational processes. These rhythmic processes, together with posttranslational modification, constitute circadian oscillators in the brain and peripheral tissues, which drive rhythms in physiology and behavior, including the sleep-wake cycle. In humans, sleep is normally timed to occur during the biological night, when body temperature is low and melatonin is synthesized. Desynchrony of sleep-wake timing and other circadian rhythms, such as occurs in shift work and jet lag, is associated with disruption of rhythmicity in physiology and endocrinology. However, to what extent mistimed sleep affects the molecular regulators of circadian rhythmicity remains to be established. Here, we show that mistimed sleep leads to a reduction of rhythmic transcripts in the human blood transcriptome from 6.4% at baseline to 1.0% during forced desynchrony of sleep and centrally driven circadian rhythms. Transcripts affected are key regulators of gene expression, including those associated with chromatin modification (methylases and acetylases), transcription (RNA polymerase II), translation (ribosomal proteins, initiation, and elongation factors), temperature-regulated transcription (cold inducible RNA-binding proteins), and core clock genes including CLOCK and ARNTL (BMAL1). We also estimated the separate contribution of sleep and circadian rhythmicity and found that the sleep-wake cycle coordinates the timing of transcription and translation in particular. The data show that mistimed sleep affects molecular processes at the core of circadian rhythm generation and imply that appropriate timing of sleep contributes significantly to the overall temporal organization of the human transcriptome.
Keywords: biological rhythms; bloodomics; chronobiology; genomics; microarray.
Conflict of interest statement
The authors declare no conflict of interest.
Figures
Fig. 1.
Forced-desynchrony protocol. (A) After a baseline day (wake 1, sleep 1), the sleep–wake cycle was extended to 28 h such that sleep period 2 was in phase with melatonin (blue area plot) but sleep period 5 commenced at noon, 12 h out of phase with sleep period 2 and the melatonin rhythm (pink area plot). Blood RNA was sampled during both in-phase (blue triangles) and out-of-phase (red triangles) conditions. Relative RNA expression levels (log2, mean ± SEM) of POLR2H (B) and NR1D2 (C) when sleeping in phase (blue circles) with melatonin [blue area plot; mean dim light melatonin onset (DLMO), 2159 hours ± 1 h and 13 min (±SD); n = 21)] (D) and when sleeping out of phase (red circles) with melatonin [pink area plot; DLMO, 2303 hours ± 1 h and 57 min (±SD); n = 21] (D).
Fig. 2.
Mistimed sleep disrupts the circadian transcriptome. (A) Median expression profiles of circadian transcripts when sleeping in phase with melatonin (Left) and their profiles when sleeping out of phase (Right) (n = 19 paired participants). Colored bars on the left indicate clusters of day-peaking (B, Upper Left) and night-peaking (B, Lower Left) transcripts. Profiles of these transcripts were disrupted when sleep occurred out of phase with melatonin (A and B, Right). Average melatonin profiles are indicated by blue and pink area plots. (C) Peak expression phase distribution of prevalent circadian transcripts while sleeping in phase (blue bars; n = 16,253 derived from 1,502 circadian transcripts in an average of 10.84 subjects; minimum number of subjects for an FDR < 5%, 10) and out of phase (red bars; n = 2,503 derived from 237 circadian transcripts in an average of 10.56 subjects). (D) A total of 733 night and 661 day in-phase circadian transcripts reduced to 95 and 134 out-of-phase transcripts, with 9 and 27 common to both (n = 19 paired participants); 108 rhythmic transcripts were not classified as either day or night when sleeping in phase, and this category contained only eight transcripts during out of phase. (E) Out-of-phase prevalent circadian transcripts (red plot) had a lower mean amplitude (0.4264, red dashed line) than in-phase prevalent transcripts (blue plot; 0.5169, blue dashed line) (95% confidence interval, −0.1012 to −0.0797; P < 2.2 × 10⁻¹⁶). (F) Top 10 GO processes and functions associated with transcripts that became arrhythmic when sleeping out of phase.
Fig. 3.
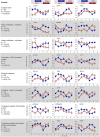
Summary of the effects of desynchrony on the regulation of gene expression. Biological processes that contribute to the regulation of gene expression are shown on the left. For each process, the mean (log2 ± SEM) expression plots while sleeping in (blue) and out (red) of phase of exemplar transcripts (identified as having a significant differential expression between conditions) associated with the process are depicted. Also provided are the number of transcripts (N) in our study that have been associated with that process, together with the number and percentage of those transcripts that showed either a main effect of sleep condition (M) or an interaction between sleep condition and sample time (I) in the ANOVA. It should be noted that the custom-designed microarrays used in this study included the addition of many probes covering the length of identified transcripts for circadian clock-related genes. That is why the circadian rhythm category in this figure includes 495 probes.
Fig. 4.
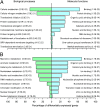
GO analysis for transcripts whose expression profiles changed between sleep conditions. Top 10 GO processes and functions associated with transcripts whose expression profile showed a significant interaction between sleep condition and sample time (A) or a main effect of sleep condition (B) (ANOVA; P < 0.05; n = 22).
Fig. 5.
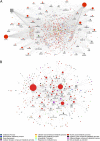
Direct interaction networks between genes for which at least one transcript had a statistically significant interaction between sleep condition and sample time (A) or a main effect of sleep condition (B). Up-regulated genes (on average) in the out-of-phase condition compared with in-phase are indicated as square nodes and down-regulated ones by circles. Node size reflects the number of direct connections a gene has within the network. Node color (see key) represents the most enriched association with a top 10 GO biological process. Downloadable, interactive versions of A and B are available at
http://sleep-sysbio.fhms.surrey.ac.uk/PNAS\_14/
.
Fig. 6.
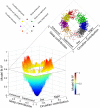
Modeling the contribution of circadian and sleep–wake drive on transcript expression profiles. A model that describes the temporal profile of transcripts as a linear combination of the 28-h sleep–wake cycle and 24-h circadian rhythmicity was fitted to the median expression profile of each transcript (median of z-scored data across 19 paired participants per sample time point). In the 3D plot, the horizontal plane maps the estimated coefficient of the contribution of the sleep–wake cycle against the contribution of the circadian rhythmicity, whereas the corresponding model fit _R_2 value is indicated by the vertical axis (n = 41,119 transcripts). Transcripts with a model fit _R_2 > 0.6 (1,792 transcripts) were further classified into eight distinct categories (indicated with different colors in the vertical plane) based on the contribution of the sleep–wake cycle and the contribution of the circadian rhythmicity as follows: transcripts with no significant sleep contribution, which were primarily determined by circadian rhythmicity with a peak at night (green) or day (orange); transcripts with a significant circadian contribution with a peak at night and an enhancing effect of sleep (red) or a suppressive effect of sleep (blue); transcripts with a significant circadian contribution with a peak during the day and an enhancing effect of sleep (purple) or a suppressive effect of sleep (pink); and transcripts with no significant circadian component, which were enhanced by sleep (yellow) or suppressed (gray).
Fig. 7.
Estimating the separate contribution of circadian rhythmicity and sleep to the temporal organization of the transcriptome. A model describing the temporal profile of transcripts as a linear combination of the 28-h sleep–wake cycle and 24-h circadian rhythmicity was fitted to the median expression profiles (z-scored data across all participants per sample point) of all transcripts (Fig. 6). The model identified transcripts that were only driven by circadian rhythmicity with a positive drive during the night (A) or a positive drive during the day (B). Two groups of transcripts were only driven by sleep, which enhanced (C) or suppressed (D) the levels of these transcripts. Other transcripts were affected positively by sleep and also by circadian rhythmicity at night (E) or circadian rhythmicity during the day (F), whereas others were suppressed by sleep and had either a circadian night (G) or day peak (H). Also shown are the group time course, number of transcripts per category, example mean expression profile (log2 ± SEM) while sleeping in (blue line) and out of phase (red line), together with top 10 GO processes and functions associated with the set of transcripts (*P < 0.05; #P < 0.01; $P < 0.001).
Comment in
- Disruption of daily rhythms in gene expression: the importance of being synchronised.
Hughes AT, Piggins HD. Hughes AT, et al. Bioessays. 2014 Jul;36(7):644-8. doi: 10.1002/bies.201400043. Epub 2014 May 16. Bioessays. 2014. PMID: 24832865 Free PMC article.
Similar articles
- Mistimed sleep and waking activity in humans disrupts glucocorticoid signalling transcripts and SP1, but not plasma cortisol rhythms.
Archer SN, Möller-Levet CS, Laing EE, Dijk DJ. Archer SN, et al. Front Physiol. 2022 Aug 17;13:946444. doi: 10.3389/fphys.2022.946444. eCollection 2022. Front Physiol. 2022. PMID: 36060675 Free PMC article. - Shift Work Disrupts Circadian Regulation of the Transcriptome in Hospital Nurses.
Resuehr D, Wu G, Johnson RL Jr, Young ME, Hogenesch JB, Gamble KL. Resuehr D, et al. J Biol Rhythms. 2019 Apr;34(2):167-177. doi: 10.1177/0748730419826694. Epub 2019 Feb 4. J Biol Rhythms. 2019. PMID: 30712475 Free PMC article. - How sleep and wakefulness influence circadian rhythmicity: effects of insufficient and mistimed sleep on the animal and human transcriptome.
Archer SN, Oster H. Archer SN, et al. J Sleep Res. 2015 Oct;24(5):476-93. doi: 10.1111/jsr.12307. Epub 2015 Jun 8. J Sleep Res. 2015. PMID: 26059855 Review. - The sleep-wake distribution contributes to the peripheral rhythms in PERIOD-2.
Hoekstra MM, Jan M, Katsioudi G, Emmenegger Y, Franken P. Hoekstra MM, et al. Elife. 2021 Dec 13;10:e69773. doi: 10.7554/eLife.69773. Elife. 2021. PMID: 34895464 Free PMC article. - Melatonin and stable circadian rhythms optimize maternal, placental and fetal physiology.
Reiter RJ, Tan DX, Korkmaz A, Rosales-Corral SA. Reiter RJ, et al. Hum Reprod Update. 2014 Mar-Apr;20(2):293-307. doi: 10.1093/humupd/dmt054. Epub 2013 Oct 16. Hum Reprod Update. 2014. PMID: 24132226 Review.
Cited by
- Mistimed sleep and waking activity in humans disrupts glucocorticoid signalling transcripts and SP1, but not plasma cortisol rhythms.
Archer SN, Möller-Levet CS, Laing EE, Dijk DJ. Archer SN, et al. Front Physiol. 2022 Aug 17;13:946444. doi: 10.3389/fphys.2022.946444. eCollection 2022. Front Physiol. 2022. PMID: 36060675 Free PMC article. - Dysrhythmic saliva microbiota in mobile phone addicts with sleep disorders and restored by acupuncture.
Mei YX, Yang K, Zhang L, Jin Y, Yang N, Yang H, Zheng YL, Pang YS, Gong YJ, Zhou H, Zuo YL, Ding WJ. Mei YX, et al. Front Psychiatry. 2024 Jun 18;15:1335554. doi: 10.3389/fpsyt.2024.1335554. eCollection 2024. Front Psychiatry. 2024. PMID: 38957739 Free PMC article. - Bright Light Increases Alertness and Not Cortisol in Healthy Men: A Forced Desynchrony Study Under Dim and Bright Light (I).
Lok R, Woelders T, van Koningsveld MJ, Oberman K, Fuhler SG, Beersma DGM, Hut RA. Lok R, et al. J Biol Rhythms. 2022 Aug;37(4):403-416. doi: 10.1177/07487304221096945. Epub 2022 Jun 10. J Biol Rhythms. 2022. PMID: 35686534 Free PMC article. - Sleep Abnormalities in Multiple Sclerosis.
Sakkas GK, Giannaki CD, Karatzaferi C, Manconi M. Sakkas GK, et al. Curr Treat Options Neurol. 2019 Jan 31;21(1):4. doi: 10.1007/s11940-019-0544-7. Curr Treat Options Neurol. 2019. PMID: 30701337 Review. - Circadian regulation in human white adipose tissue revealed by transcriptome and metabolic network analysis.
Christou S, Wehrens SMT, Isherwood C, Möller-Levet CS, Wu H, Revell VL, Bucca G, Skene DJ, Laing EE, Archer SN, Johnston JD. Christou S, et al. Sci Rep. 2019 Feb 25;9(1):2641. doi: 10.1038/s41598-019-39668-3. Sci Rep. 2019. PMID: 30804433 Free PMC article.
References
- Bass J. Circadian topology of metabolism. Nature. 2012;491(7424):348–356. - PubMed
- Etchegaray JP, Lee C, Wade PA, Reppert SM. Rhythmic histone acetylation underlies transcription in the mammalian circadian clock. Nature. 2003;421(6919):177–182. - PubMed
Publication types
MeSH terms
Substances
LinkOut - more resources
Full Text Sources
Other Literature Sources
Molecular Biology Databases


