Ultrasound-mediated blood-brain barrier disruption for targeted drug delivery in the central nervous system - PubMed (original) (raw)
Review
Ultrasound-mediated blood-brain barrier disruption for targeted drug delivery in the central nervous system
Muna Aryal et al. Adv Drug Deliv Rev. 2014 Jun.
Abstract
The physiology of the vasculature in the central nervous system (CNS), which includes the blood-brain barrier (BBB) and other factors, complicates the delivery of most drugs to the brain. Different methods have been used to bypass the BBB, but they have limitations such as being invasive, non-targeted or requiring the formulation of new drugs. Focused ultrasound (FUS), when combined with circulating microbubbles, is a noninvasive method to locally and transiently disrupt the BBB at discrete targets. This review provides insight on the current status of this unique drug delivery technique, experience in preclinical models, and potential for clinical translation. If translated to humans, this method would offer a flexible means to target therapeutics to desired points or volumes in the brain, and enable the whole arsenal of drugs in the CNS that are currently prevented by the BBB.
Keywords: Brain; Drug delivery; Microbubbles; Ultrasound.
Copyright © 2014 Elsevier B.V. All rights reserved.
Figures
Figure 1
Contrast-enhanced T1-weighted MRI of the brain of a rhesus macaque showing enhancement at four focal targets in the cingulate cortex after injection of Gd-DTPA. (Left image: Axial; Middle: Sagittal; Right: Coronal). Enhancement of this MRI contrast agent, which normally does not extravasate into the brain, indicates areas with BBB disruption. Four targets were sonicated using a 220 kHz clinical MRI-guided FUS system along with an infusion of Definity microbubbles. The dimensions of the disrupted spots were approximately 3 mm wide and 4 mm long. Note the leakage of contrast agent into the cingulate sulcus evident in the sagittal image (arrow). These images were obtained in a study evaluating passive cavitation mapping during microbubble-enhanced FUS [176] (bar: 1 cm)
Figure 2
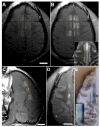
Demonstration of FUS-induced BBB disruption using contrast enhanced MRI and trypan blue. (A–C) Contrast-enhanced T1-weighted MRI after BBB disruption at six volumes in the cingulate cortex. At each volume, the focal region was steered electronically in sequence to nine targets in a 3×3 grid using a phased array. (A) Low-level enhancement observed with gadofosveset trisodium, an MR contrast agent that binds to albumin in the blood (MW of albumin: ~67 kDa); it was administered before sonication. (B) Enhancement after injection of Gd-DTPA (MW: 938 Da). The inset in (B) shows the same view in T2-weighted imaging. The enhancement patterns correspond to regions of cortical gray matter visible in T2-weighted imaging. (C) Sagittal view of Gd-DTPA enhancement, which included leakage of agent into a sulcus (arrow). (D–E) Volumetric BBB disruption at three targets centered on the boundary between the cingulate cortex and white matter; from another experimental session in this animal. (D) T1-weighted MRI showing Gd-DTPA extravasation in the cingulate cortex, but not in the white matter. (E) Photograph of formalin-fixed brain showing trypan blue extravasation into both the cingulate cortex and white matter. This differential enhancement between gray and white matter presumably reflects differences in vascular density. The white matter component of two of these targets is shown with increased image contrast in the inset to better visualize low-level trypan blue extravasation. (scale bars: 1 cm). Reprinted from Cancer Research 2012; 72:3652–3663; © 2012 American Association for Cancer Research
Figure 3
Normal-appearing histology after FUS-induced BBB disruption. This example was obtained after volumetric sonication to induce BBB disruption in the hippocampus and lateral geniculate nucleus (LGN) in macaque. This target was sonicated approximately two hours before the animal was sacrificed and in seven prior sessions over several months. (A) Axial contrast-enhanced T1-weighted MRI showing BBB disruption induced by sonicating nine targets in a 3×3 grid. (B) Low-magnification microphotograph showing histology in the hippocampus/LGN. (C–D) High-magnification views showing normal-appearing layers in the LGN. (E–G): High-magnification views of hippocampus showing the granular cell layer (E) and the pyramid layers (F–G). H: Blood vessels in the LGN with a few extravasated red blood cells, presumably from the last sonication session. Only a very small number of such extravasations were found. (B–G: Nissl; H: H&E; scale bars: A: 1 cm, B–D: 1 mm, E–H: 200 μm). Reprinted from Cancer Research 2012; 72:3652–3663; © 2012 American Association for Cancer Research.
Figure 4
BBB permeability for horseradish peroxidase (HRP). (A) Photomicrograph showing part of a cross-sectioned microvessel and the surrounding nerve tissue from a nonsonicated area. No HRP passage to the basement membrane (arrowheads) or the neuropil (NP) can be seen. The lumen (L) appears empty because the tracer was washed out during perfusion fixation. (B) A portion of a microvessel with adjacent nerve tissue from a sample obtained 1 h after sonication. Passage of HRP (black color) through several interendothelial clefts is indicated by arrowheads. The tracer has infiltrated the basement membrane (B) and the interstitial space (arrows) in the neuropil. (C) A portion of longitudinally sectioned capillary in a sample obtained 2 h after sonication. The tracer is present in the junctional cleft (arrows), the basement membrane (B) and the interstitial spaces (asterisks) between myelinated axons (Ax). (D) Full restoration of the tight junctional barrier function 4 h after sonication. Immersion fixation (instead of perfusion fixation) was used in this brain and permits visualization of the tracer (black) filling the lumen (L) and being stopped at the first tight-junction (arrow). No penetration can be seen in the rest of the junctional cleft (arrowheads), nor in the basement membrane (B) or neuropil (NP). E: endothelial cell cytoplasm; RBC: red blood cell in the lumen. Scale bars: 200 nm. Modified from Ultrasound in Med. & Biol., Vol. 34, No. 7, pp. 1093–1104, 2008; Copyright © 2008 World Federation for Ultrasound in Medicine & Biology. (E) Electron micrograph of an arteriole 1 h after sonication at 0.26 MHz. An intense vesicular transport is demonstrated by the increased number of HRP-positive caveolae (arrows). Significantly fewer vesicles were observed in capillaries and venules. L: lumen. Modified from Ultrasound in Med. & Biol., Vol. 32, No. 9, pp. 1399–1409, 2006; Copyright © 2006 World Federation for Ultrasound in Medicine & Biology
Figure 5
Vascular effects observed in real time during FUS-induced BBB disruption using in vivo multiphoton microscopy. Each frame is a 615×615 μm image acquired using in a mouse before, during, and approximately 20 min after sonication. Arterioles and veins (determined by dye transit) are marked `a' and `v' respectively, in the first frame. The animal received 0.1mL (2 mg/mL) 10 kDa, dextran-conjugated Alexa Fluor 488 intravenously ~5 mins before imaging (green in images) Immediately after the first frame was taken, a 45-sec US exposure was initiated and a 0.1mL bolus (10 mg/mL) of 70 kDa, dextran-conjugated Texas Red was delivered intravenously (red in images). Almost total occlusion of the large vessel in the center of the field occurred 12 secs after the initiation of US (arrow). Beginning at 60 secs and by 305 secs, leakage in the green channel is apparent in the lower left of the field, and around the central vessel. Modified from Journal of Cerebral Blood Flow & Metabolism 2007;27(2):393–403; Copyright © 2006 ISCBFM.
Figure 6
Delivery of fluorescent dextrans with different sizes across the BBB in a mouse using FUS and microbubbles (A: 3 kDa; B: 10 kDa; C: 70 kDa; bar: 1 mm). Diffuse fluorescence regions can be observed for all dextrans, whereas spots of high fluorescence are observed only with the 70-kDa dextran. Modified from Proc Natl Acad Sci U S A 2011; 108: 16539–16544; © 2011 by The National Academy of Sciences of the USA.
Figure 7
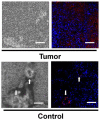
Confocal micrographs of tissue from tumor after FUS-induced BTB permeabilization followed by magnetic targeting and contralateral brain regions after delivery of magnetic nanoparticles (MNPs) loaded with epirubicin. Dark structures in the phase micrographs show MNPs (Left); fused fluorescence images (Right) indicate the presence of epirubicin (red) and DAPI-stained nuclei (blue). Arrows indicate the capillaries; epirubicin occurs in the capillary beds but does not penetrate into the brain parenchyma. Modified from Proc Natl Acad Sci U S A 2010; 107: 15205-15210; © 2011 by The National Academy of Sciences of the USA.
Figure 8
Gene transfer to neurons, astrocytes, and oligodendrocytes after delivery of adeno-associated virus serotype 9 carrying the green fluorescent protein (GFP) to the mouse brain via FUS-induced BBB disruption. Immunohistochemistry was used to detect GFP expression in hippocampus for (a) NeuN-positive cells (neurons, white arrows), and striatum for (b) GFAP-positive cells (astrocytes, white arrows) and (c) Olig2-positive cells (oligodendrocytes, white arrow). Modified from Human Gene Therapy 23:1144–1155 (November 2012); © 2012 Mary Ann Liebert, Inc.
Figure 9
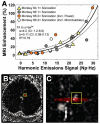
Comparison of MRI signal enhancement with microbubble acoustic emissions. (A) MRI signal enhancement after Gd-DTPA injection plotted as a function of the harmonic emissions signal strength measured with single-element detectors. A clear relationship between the two measurements was observed with a good fit to an exponential. The agreement appeared to hold among different animals and in cases where targets with low-level harmonic emissions were sonicated a second time with either a higher power level or an increased dose of microbubbles. Reprinted from PLoS ONE 7(9): e45783. doi:10.1371/journal.pone.0045783; © 2012 Arvanitis et al. (B–C) Comparison between MRI signal enhancement and passive cavitation mapping. (B) Map showing the enhancement relative to a pre-contrast image. (C) Fusion of passive acoustic map with the T1-weighted MRI from (B). The red region shows the pixels in the cavitation map within 95% of the maximum value. This region overlapped with the contrast enhancement. The pixel with the maximum cavitation activity is noted with a “+”. The enhancement from other targets sonicated in the same session is visible; Modified from Phys Med Biol 58.14 (2013): 4749–61; © 2013 Institute of Physics and Engineering in Medicine.
Figure 10
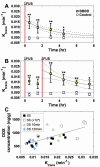
Using DCE-MRI to evaluate FUS-BBB disruption. (A–B) Mean Ktrans values measured vs. time from DCE-MRI in regions of interest at sonicated locations and in corresponding non-sonicated structures in the contralateral hemisphere. The decay of K, which occurred due to restoration of the BBB, was fit to an exponential decay (solid line; dotted lines: 95% CI). (A) Decay after a single sonication. (B) Time course after two sonications separated by 120 min. The second sonication increased the amount of time the barrier was disrupted. Values were significantly higher than in control locations in the contralateral hemisphere (**P<0.01 and *P<0.05). (C) DOX concentration achieved at the sonicated locations as function of _K_trans measured using DCE-MRI 30 min after sonication. The DOX concentration was measured approximately 16 hrs later for brain targets in single sonication (SS), single sonication with hyperintense spots in T2* weighted image (SS (+ T2*)), double sonication with 10 min interval (DS 10 min), and double sonication with 120 min interval (DS 120 min). The solid line shows a linear regression of the data (slope: 28,824 ng/g DOX per change in _K_trans in min−1; intercept: 377 ng/g DOX; R: 0.7). Modified from Journal of Controlled Release 2012;162:134–142; © 2012 Elsevier B.V.
Similar articles
- Non-invasive delivery of stealth, brain-penetrating nanoparticles across the blood-brain barrier using MRI-guided focused ultrasound.
Nance E, Timbie K, Miller GW, Song J, Louttit C, Klibanov AL, Shih TY, Swaminathan G, Tamargo RJ, Woodworth GF, Hanes J, Price RJ. Nance E, et al. J Control Release. 2014 Sep 10;189:123-132. doi: 10.1016/j.jconrel.2014.06.031. Epub 2014 Jun 28. J Control Release. 2014. PMID: 24979210 Free PMC article. - Noninvasive, transient and selective blood-brain barrier opening in non-human primates in vivo.
Marquet F, Tung YS, Teichert T, Ferrera VP, Konofagou EE. Marquet F, et al. PLoS One. 2011;6(7):e22598. doi: 10.1371/journal.pone.0022598. Epub 2011 Jul 22. PLoS One. 2011. PMID: 21799913 Free PMC article. - Optimization of the ultrasound-induced blood-brain barrier opening.
Konofagou EE. Konofagou EE. Theranostics. 2012;2(12):1223-37. doi: 10.7150/thno.5576. Epub 2012 Dec 31. Theranostics. 2012. PMID: 23382778 Free PMC article. - Drug and gene delivery across the blood-brain barrier with focused ultrasound.
Timbie KF, Mead BP, Price RJ. Timbie KF, et al. J Control Release. 2015 Dec 10;219:61-75. doi: 10.1016/j.jconrel.2015.08.059. Epub 2015 Sep 8. J Control Release. 2015. PMID: 26362698 Free PMC article. Review. - Noninvasive and targeted drug delivery to the brain using focused ultrasound.
Burgess A, Hynynen K. Burgess A, et al. ACS Chem Neurosci. 2013 Apr 17;4(4):519-26. doi: 10.1021/cn300191b. Epub 2013 Feb 4. ACS Chem Neurosci. 2013. PMID: 23379618 Free PMC article. Review.
Cited by
- Non-Invasive Drug Delivery across the Blood-Brain Barrier: A Prospective Analysis.
Niazi SK. Niazi SK. Pharmaceutics. 2023 Nov 7;15(11):2599. doi: 10.3390/pharmaceutics15112599. Pharmaceutics. 2023. PMID: 38004577 Free PMC article. Review. - Gliomas and the vascular fragility of the blood brain barrier.
Dubois LG, Campanati L, Righy C, D'Andrea-Meira I, Spohr TC, Porto-Carreiro I, Pereira CM, Balça-Silva J, Kahn SA, DosSantos MF, Oliveira Mde A, Ximenes-da-Silva A, Lopes MC, Faveret E, Gasparetto EL, Moura-Neto V. Dubois LG, et al. Front Cell Neurosci. 2014 Dec 12;8:418. doi: 10.3389/fncel.2014.00418. eCollection 2014. Front Cell Neurosci. 2014. PMID: 25565956 Free PMC article. Review. - Temporal Characterization of Blood-Brain Barrier Disruption with High-Frequency Electroporation.
Lorenzo MF, Thomas SC, Kani Y, Hinckley J, Lee M, Adler J, Verbridge SS, Hsu FC, Robertson JL, Davalos RV, Rossmeisl JH Jr. Lorenzo MF, et al. Cancers (Basel). 2019 Nov 23;11(12):1850. doi: 10.3390/cancers11121850. Cancers (Basel). 2019. PMID: 31771214 Free PMC article. - Targeting Early Dementia: Using Lipid Cubic Phase Nanocarriers to Cross the Blood⁻Brain Barrier.
D'Arrigo JS. D'Arrigo JS. Biomimetics (Basel). 2018 Mar 7;3(1):4. doi: 10.3390/biomimetics3010004. Biomimetics (Basel). 2018. PMID: 31105226 Free PMC article. Review. - Ultrasound-Mediated Drug Delivery: Sonoporation Mechanisms, Biophysics, and Critical Factors.
Tu J, Yu ACH. Tu J, et al. BME Front. 2022 Jan 29;2022:9807347. doi: 10.34133/2022/9807347. eCollection 2022. BME Front. 2022. PMID: 37850169 Free PMC article. Review.
References
- Neuwelt EA, Bauer B, Fahlke C, Fricker G, Iadecola C, Janigro D, Leybaert L, Molnar Z, O'Donnell ME, Povlishock JT, Saunders NR, Sharp F, Stanimirovic D, Watts RJ, Drewes LR. Engaging neuroscience to advance translational research in brain barrier biology. Nat Rev Neurosci. 2011;12:169–182. - PMC - PubMed
- Abbott NJ, Romero IA. Transporting therapeutics across the blood-brain barrier. Mol. Med Today. 1996;2:106–113. - PubMed
- Pardridge WM. Molecular biology of the blood-brain barrier. Mol. Biotechnol. 2005;30:57–70. - PubMed
- Minniti G, Amelio D, Amichetti M, Salvati M, Muni R, Bozzao A, Lanzetta G, Scarpino S, Arcella A, Enrici RM. Patterns of failure and comparison of different target volume delineations in patients with glioblastoma treated with conformal radiotherapy plus concomitant and adjuvant temozolomide. Radiother. Oncol. 2010;97:377–381. - PubMed
Publication types
MeSH terms
LinkOut - more resources
Full Text Sources
Other Literature Sources


