Proteasome failure promotes positioning of lysosomes around the aggresome via local block of microtubule-dependent transport - PubMed (original) (raw)
Proteasome failure promotes positioning of lysosomes around the aggresome via local block of microtubule-dependent transport
Nava Zaarur et al. Mol Cell Biol. 2014 Apr.
Abstract
Ubiquitinated proteins aggregate upon proteasome failure, and the aggregates are transported to the aggresome. In aggresomes, protein aggregates are actively degraded by the autophagy-lysosome pathway, but why targeting the aggresome promotes degradation of aggregated species is currently unknown. Here we report that the important factor in this process is clustering of lysosomes around the aggresome via a novel mechanism. Proteasome inhibition causes formation of a zone around the centrosome where microtubular transport of lysosomes is suppressed, resulting in their entrapment and accumulation. Microtubule-dependent transport of other organelles, including autophagosomes, mitochondria, and endosomes, is also blocked in this entrapment zone (E-zone), while movement of organelles at the cell periphery remains unaffected. Following the whole-genome small interfering RNA (siRNA) screen for proteins involved in aggresome formation, we defined the pathway that regulates formation of the E-zone, including the Stk11 protein kinase, the Usp9x deubiquitinating enzyme, and their substrate kinase MARK4. Therefore, upon proteasome failure, targeting of aggregated proteins of the aggresome is coordinated with lysosome positioning around this body to facilitate degradation of the abnormal species.
Figures
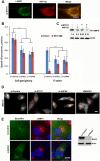
FIG 1
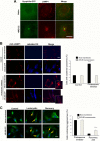
Lysosomal positioning plays an important role in autophagic degradation of aggresomes. (A) Lysosomes position around the aggresome following proteasome inhibition. MCF10A cells expressing synphilin-GFP were incubated with or without 0.2 μM MG132 for 4 h, fixed, and immunostained with Lamp1 antibody. (B) Expression of Arl8b prevents lysosome clustering upon proteasome inhibition. HeLa cells were transfected with CFP-Arl8b-expressing plasmid or mock transfected with and without a proteasome inhibitor, 10 μM lactacystin. Lysosomes were visualized by immunostaining with LAMP1 antibody. The number of cells with clustered lysosome was counted and quantified. (C) Expression of Arl8b suppresses degradation of aggresomes. Synphilin-GFP-expressing cells were transfected with CFP-Arl8b plasmid or mock transfected. Cells were treated with 10 μM lactacystin for 16 h and then recovered for 24 h. The number of cells with aggresomes was counted and quantified. ***, P < 0.001. Bars, 10 μm.
FIG 2
Proteasome inhibition leads to lysosomal positioning in the perinuclear area. (A) The time course of accumulation of RFP-Ub-positive vesicles in the perinuclear area. HeLa cells stably expressing RFP-Ub were incubated with or without 10 μM MG132 for the indicated time periods. (B) Colocalization of RFP-Ub-labeled aggresome with anti-γ-tubulin (green) after 5 h of incubation with MG132. For visualization of γ-tubulin, cells were fixed with methanol. Under those conditions, all lysosomes are dissolved, and therefore only the RFP-Ub-labeled aggresome can be seen. (C) HeLa cells expressing RFP-Ub were incubated with MG132 for 4 h, and then 2% Triton X-100 was added, and images were taken at the indicated times. The aggresome seen in the last picture (40 sec) continued to be seen for at least 10 min after the detergent addition. (D) Colocalization of RFP-Ub-positive vesicles with LAMP1. Cells expressing RFP-Ub were incubated with or without MG132 for 5 h and then fixed and immunostained with anti-LAMP1 antibody. (E) Colocalization of RFP-Ub with GFP-LAMP1. Cells expressing Ub-RFP were transfected with GFP-LAMP1 and incubated with or without MG132 for 5 h, and images were taken. The arrows show the aggresome, which did not colocalize with lysosomes. Bars, 10 μm.
FIG 3
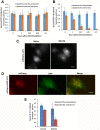
Differential inhibition of lysosome mobility leads to formation of the E-zone. (A) Cells were incubated with MG132 for the indicated times. The speed of lysosomes moving toward and away from the centrosome was calculated. Lysosomes were tracked at the cell periphery, and their directional speed was calculated. The reference point was the cell center. (B) Lysosomes were tracked at the cell periphery and in the central part of the cell in the same experiment as described for panel A, and the local speed of the lysosome was calculated. For details of the lysosome tracking and speed calculation, see Materials and Methods. The error is indicated as 1 standard deviation. (C) LC3 accumulates in the E-zone. HeLa cells were transfected with mCherry-GFP-LC3. At 24 h after transfection, cells were incubated with or without MG132 for 7 h, and images were taken in the Texas Red channel. (D) Autophagic vacuoles fused with lysosomes are present in the E-zone. HeLa cells were transfected with mCherry-GFP-LC3 and incubated with MG132 for 5 h. Arrows point at red-only dots that represent autophagosomes after fusion; see the text for explanations. (E) Speed of LC-3 red-only dots (autophagolysosomes) at the cell center and periphery. HeLa cells were transfected with mCherry-GFP-LC3 and incubated with or without MG132 for 5 h. The red-only dots were tracked using the tracking method mentioned before. Bars, 10 μm.
FIG 4
Proteasome inhibition causes general suppression of organelle transport. (A) Mitochondria accumulate in the E-zone. HeLa cells expressing Ub-RFP were incubated with or without MG132. After 4 h, MitoTracker green was added for 1 h, and images were taken. (B) Mitochondria in the E-zone are charged. HeLa cells were incubated with MG132. After 4.5 h, 10 μM rhodamine 123 was added for 20 min to detect the mitochondrial membrane potential. Bars, 10 μm.
FIG 5
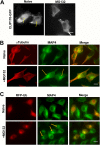
Proteasome inhibition affects properties of microtubules in the E-zone. (A) Effects of MG132 on the microtubular dynamics. Cells were transfected with CLIP170-GFP and then incubated with or without MG132 for 5 h, and images were taken in the time-lapse mode. Ten consecutive time-lapse images were flattened using ImageJ. Arrows show the origin of the CLIP-170 growth. (B) MAP4 localizes at the E-zone upon incubation with MG132. HeLa cells were incubated with or without MG132 and immunostained with anti-MAP4 (green) and antitubulin (red) antibodies. (C) MAP4 localizes at the E-zone with clustered RFP-Ub-positive lysosomes. HeLa cells expressing RFP-Ub were incubated with and without MG132 and immunostained with anti-MAP4. Bars, 10 μm.
FIG 6
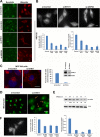
Depletion of STK11, USP9X, or MARK4 affects lysosome clustering upon proteasome inhibition. (A) Screen results. Cells were treated as mentioned in the screen description (see Results). Here we show control, siSTK11, and siUSP9X cells with and without 10 μM MG132. (B) HeLa cells expressing RFP-Ub were transfected with STK11 siRNA, USP9X siRNA, or luciferase siRNA as a control (si-Control). Two distinct sequences each for STK11 (seq1 [UGAAAGGGAUGCUUGAGUA] or seq2 [GAGAAGCGUUUCCCAGUGU]) and Usp9X (seq1 [ACACGAUGCUUUAGAAUUU] or seq2 [GUACGACGAUGUAUUCUCA]) were tested. At 72 h after transfection, cells were treated with MG132 for 5 h, and images were taken. (Upper panel) Representative images of RFP-Ub-labeled lysosomes. (Lower left panel) Cells with lysosome clustering were counted and quantified. (Lower right panel) Parallel samples from this experiment were subjected to RT-PCR to evaluate the degree of the depletion. (C) Depletion of STK11 reduces lysosome clustering in MCF10A cells. MCF10A cells were depleted of STK11-seq1 and treated with 0.2 μM MG132 for 4 h. The cells were immunostained with LAMP1 and DAPI. The number of cells with perinuclear lysosome clustering was counted and quantified. Cells were assayed by immunoblotting to evaluate STK11 depletion. (D) Effect of depletion of STK11 on distribution of mitochondria to the E-zone. HeLa cells were depleted of STK11 and incubated with or without 5 μM MG132 for 4 h and then treated with MitoTracker. The line marks the cell border. Dots show the position of the aggresome. (E) Effects of MG132 on the activity of STK11. Cells were incubated with MG132, for the indicated times, and assayed by immunoblotting using ph-AMPK antibody. The bands were quantified using ImageJ; the numbers at the bottom show the intensities of the band in arbitrary units after normalization to actin. (F) Depletion of MARK4 reduces lysosome clustering. Cells expressing RFP-Ub were transfected against 3 distinct instances of si-MARK4 (and 72 h later were incubated with MG132 for 5 h). (Left panel) Image of lysosomes in cells treated with si-MARK4-seq1. (Middle panel) The number of cells with lysosome clustering was counted and quantified for all 3 siRNA sequences (seq1 [GAUCGAAGCUGGACACGUU], seq2 [GGAUCAACAUCGGCUAUGA], and seq3 [GCUGUACUCUCGAGCAAAU]). (Right panel) Parallel samples from this experiment were subjected to RT-PCR to evaluate the degree of the depletion. The error bars represent standard deviations (SD). Bars, 10 μm.
FIG 7
Depletion of STK11, Usp9x, or MARK4 affects the E-zone. (A) RFP-Ub colocalizes with LAMP1 in siSTK11 cells. HeLa cells expressing RFP-Ub were transfected with siSTK11, incubated with MG132 for 5 h, and immunostained for anti-LAMP1. (B) Effects of depletion of STK11 or USP9X on the speed of RFP-Ub-positive lysosomes at cell periphery and in the E-zone. Cells were incubated with or without MG132 for 5 h, and lysosome movement was monitored at the cell periphery and in the E-zone. For details of the lysosome tracking and speed calculation, see Materials and Methods. (C) Effect of si-STK11 depletion and inhibition of proteasome on phosphorylation of AMPK. HeLa cells were transfected with si-Control and si-STK11, incubated with MG132 for 4 h, and assayed for ph-AMPK by immunoblotting. (D) Effects of depletion of STK11, USPP9X, and MARK4 on the size of the E-zone. The E-zone is marked by a circle, as seen in Movie S16 in the supplemental material and in Movies S17 and S18 at
http://www.bumc.bu.edu/biochemistry/people/faculty/michael-y-sherman/sherman-lab-video/
. (E) Lysosome clustering can be dissociated from aggresome formation. MCF10A cells expressing GFP-synphilin were transfected with si-Control or si-BAG3 and treated with 0.2 μM MG132 for 4 h and assayed by immunostaining for Lamp1 (DAPI is also shown). The arrow shows the aggresome. The same samples were assayed by immunoblotting to evaluate the level of depletion. Bars, 10 μm.
Similar articles
- Characterization and dynamics of aggresome formation by a cytosolic GFP-chimera.
García-Mata R, Bebök Z, Sorscher EJ, Sztul ES. García-Mata R, et al. J Cell Biol. 1999 Sep 20;146(6):1239-54. doi: 10.1083/jcb.146.6.1239. J Cell Biol. 1999. PMID: 10491388 Free PMC article. - Triggering aggresome formation. Dissecting aggresome-targeting and aggregation signals in synphilin 1.
Zaarur N, Meriin AB, Gabai VL, Sherman MY. Zaarur N, et al. J Biol Chem. 2008 Oct 10;283(41):27575-27584. doi: 10.1074/jbc.M802216200. Epub 2008 Jul 17. J Biol Chem. 2008. PMID: 18635553 - The GST-BHMT assay reveals a distinct mechanism underlying proteasome inhibition-induced macroautophagy in mammalian cells.
Rui YN, Xu Z, Chen Z, Zhang S. Rui YN, et al. Autophagy. 2015;11(5):812-32. doi: 10.1080/15548627.2015.1034402. Autophagy. 2015. PMID: 25984893 Free PMC article. - The Roles of Ubiquitin in Mediating Autophagy.
Yin Z, Popelka H, Lei Y, Yang Y, Klionsky DJ. Yin Z, et al. Cells. 2020 Sep 2;9(9):2025. doi: 10.3390/cells9092025. Cells. 2020. PMID: 32887506 Free PMC article. Review. - Aggresome formation and neurodegenerative diseases: therapeutic implications.
Olzmann JA, Li L, Chin LS. Olzmann JA, et al. Curr Med Chem. 2008;15(1):47-60. doi: 10.2174/092986708783330692. Curr Med Chem. 2008. PMID: 18220762 Free PMC article. Review.
Cited by
- Targeting bortezomib-induced aggresome formation using vinorelbine enhances the cytotoxic effect along with ER stress loading in breast cancer cell lines.
Miyahara K, Kazama H, Kokuba H, Komatsu S, Hirota A, Takemura J, Hirasawa K, Moriya S, Abe A, Hiramoto M, Ishikawa T, Miyazawa K. Miyahara K, et al. Int J Oncol. 2016 Nov;49(5):1848-1858. doi: 10.3892/ijo.2016.3673. Epub 2016 Aug 29. Int J Oncol. 2016. PMID: 27601063 Free PMC article. - Pomegranate activates TFEB to promote autophagy-lysosomal fitness and mitophagy.
Tan S, Yu CY, Sim ZW, Low ZS, Lee B, See F, Min N, Gautam A, Chu JJH, Ng KW, Wong E. Tan S, et al. Sci Rep. 2019 Jan 24;9(1):727. doi: 10.1038/s41598-018-37400-1. Sci Rep. 2019. PMID: 30679718 Free PMC article. - Coronavirus cell entry occurs through the endo-/lysosomal pathway in a proteolysis-dependent manner.
Burkard C, Verheije MH, Wicht O, van Kasteren SI, van Kuppeveld FJ, Haagmans BL, Pelkmans L, Rottier PJ, Bosch BJ, de Haan CA. Burkard C, et al. PLoS Pathog. 2014 Nov 6;10(11):e1004502. doi: 10.1371/journal.ppat.1004502. eCollection 2014 Nov. PLoS Pathog. 2014. PMID: 25375324 Free PMC article. - Regulation of angiogenesis by endocytic trafficking mediated by cytoplasmic dynein 1 light intermediate chain 1.
Johnson D, Colijn S, Richee J, Yano J, Burns M, Davis AE, Pham VN, Saric A, Jain A, Yin Y, Castranova D, Melani M, Fujita M, Grainger S, Bonifacino JS, Weinstein BM, Stratman AN. Johnson D, et al. bioRxiv [Preprint]. 2024 Apr 1:2024.04.01.587559. doi: 10.1101/2024.04.01.587559. bioRxiv. 2024. PMID: 38903077 Free PMC article. Preprint. - Multimodal actions of the phytochemical sulforaphane suppress both AR and AR-V7 in 22Rv1 cells: Advocating a potent pharmaceutical combination against castration-resistant prostate cancer.
Khurana N, Kim H, Chandra PK, Talwar S, Sharma P, Abdel-Mageed AB, Sikka SC, Mondal D. Khurana N, et al. Oncol Rep. 2017 Nov;38(5):2774-2786. doi: 10.3892/or.2017.5932. Epub 2017 Aug 30. Oncol Rep. 2017. PMID: 28901514 Free PMC article.
References
Publication types
MeSH terms
Substances
LinkOut - more resources
Full Text Sources
Other Literature Sources
